

Introduction
The future of downtowns is on the ballot: After four years of a prolonged recovery period from the COVID-19 pandemic, cities and regions across the nation are releasing action plans to reimagine growth in an age of hybrid work and extreme inequality. However, the tools for funding, sustaining, and measuring the success of many of these plans are still being legislated and voted on—and the time is now for a broader coalition of downtown stakeholders to shape their implementation and success.
In the fall of 2022, the Brookings Institution’s Bass Center for Transformative Placemaking launched a project focused on the future of downtowns. This research-to-action learning exchange engaged teams of public-, private-, and civic-sector leaders from four large U.S. cities—New York City, Chicago, Philadelphia, and Seattle—over several months to explore how urban downtowns can advance more inclusive growth as they recover from the pandemic and its cascading socioeconomic aftershocks.
As part of the learning exchange, we engaged with these leaders to wrestle with the challenge of designing, implementing, and paying for policies that both support downtown recovery and advance shared prosperity between downtowns and neighborhoods.
Our research and engagement revealed that local leaders are struggling to navigate a growing chasm between perceptions and reality, across diverse and seemingly unrelated policy areas from public safety to adaptive reuse, that cannot simply be reconciled. Instead, bridging this chasm will require multiple tailored responses and nuanced, flexible leadership in a time of hyper-partisanship. Several previous publications reveal the complex challenges facing downtown coalitions, including:
- Breaking the ‘urban doom loop’: The future of downtowns is shared prosperity
- Myths about converting offices into housing—and what can really revitalize downtowns
- Apprenticeships for office jobs can prepare downtowns for the future of work
- The geography of crime in four US cities: Perceptions and reality
- Homelessness in US cities and downtowns: The perception, the reality, and how to address both
- Ensuring the intertwined post-pandemic recoveries of downtowns and transit systems
- One size doesn’t fit all for understanding downtown recovery
Many local leaders—both within and beyond the four learning exchange cities—have done substantial work to craft and begin implementing post-pandemic downtown plans. However, as cities have emerged from a time of great disruption, loss, and isolation—with many public officials burned out from responding to the pandemic or facing transitions with term limits and election cycles—cities and their leaders have struggled to summon the creativity and accountability necessary to authentically incorporate progress on racial and economic justice into these agendas. For example, across major U.S. cities, the challenge of homelessness and tent encampments has come to symbolize the unfairness and the infeasibility of looking to downtowns to solve the problems of whole regions.
Getting shared prosperity right is not easy. To get the right outcomes and to fully rebuild, cities and regions need very carefully designed policies that support the economic, business, and moral case for equitable growth and that meet the needs of those traditionally marginalized in the economy and society. And careful policy design isn’t enough: cities need to be able to afford to fund and sustain them.
What is shared prosperity?
The textbook definition of a metropolitan area’s “prosperity” is per capita gross regional product (GRP), which is an expression of the average wealth and income an economy produces. However, U.S. metropolitan regions also contain enormous inequalities across race and place, as measured by, for example, the difference in median incomes between white and Black workers, or in the highest quintile of neighborhoods compared to the lowest quintile of neighborhoods. Shared prosperity means an economy in which prosperity grows while inequality narrows. Our colleagues at Brookings have articulated three principles that advance shared prosperity and inclusive growth:
- Creating new, high-quality opportunities for workers and businesses to grow, particularly while accounting for historical disparities across race and place
- Enhancing upward mobility for households in ways that narrow demographic disparities
- Investing in quality of life and hyperlocal civic capacity across all neighborhoods
The consequences of overlooking shared prosperity and accepting a status quo of inequality, however, are grim and make one thing clear: The real “urban doom loop” threatening U.S. cities and their downtowns are counterproductive policies that attempt to rewind to a 2019 baseline or reimplement the revitalization playbook of the 1990s. While it may be tempting to revert to such policies in a time of disruption, they would only render cities’ complex challenges harder to solve by leaving wounds bleeding under a bandage.
If local leaders instead focus on creating downtowns that people want to live in, work in, and go to—rather than places they have to live in, work in, or go to—by making them more diverse, flexible, accessible, and lovable, downtowns can think beyond the status quo to usher in a brighter future for entire cities and regions. Doing so, however, requires rethinking traditional structures, systems, rules, and incentives to be less rigid and dogmatic, and it also requires broadening the coalition of actors dedicated to downtown and neighborhood recovery.
This report aims to aid local public-, private-, and civic-sector leaders in cities nationwide as they wrestle with the multifaceted challenges facing downtowns and neighborhoods. First, it presents the case for why downtowns matter—not only as the heart of their regional economies, but as engines of inclusive economic growth and shared prosperity. Second, we present a set of seven policy recommendations, interwoven with specific case studies, that offers concrete and actionable ways that cities can energize their downtowns to be prosperous and to be part of the solution to the growing challenge of economic and geographic inequity. Though the potential costs of the doom loop are daunting, the potential rewards of shared prosperity are inspiring.
Why and how downtowns matter for shared prosperity
Productive downtowns buoy productive cities and regions
Downtowns are the most intense clusters of jobs in their metro areas—concentrating both higher-wage jobs (such as those in finance, insurance, law, or public administration) and lower-wage jobs (such as those in the arts or hospitality). Prior to the pandemic, Brookings research on job location trends and metropolitan America’s activity centers found that employers across the knowledge, innovation, and service sectors, in particular, had a strong preference for hyperlocal proximity to other employers. In other words, even after decades of suburbanization, jobs in many sectors were increasingly clustering near other jobs at the neighborhood scale, breathing new economic energy into historic downtowns, giving rise to innovation districts, and powering new job hubs in and around cities.
This was simply new confirmation of an age-old economic theory: the power of “agglomeration” at the hyperlocal level. There are many explanations for why this agglomeration effect occurs, including that proximity enables employers to more efficiently share labor, infrastructure, services, and amenities. Clustering also makes it easier for individuals and firms to explore and compare services, goods, and job candidates. And finally, nearness also reduces the cost of communication and boosts the odds of chance encounters, two key mechanisms that drive the transfer of knowledge and the creative spark of innovation.
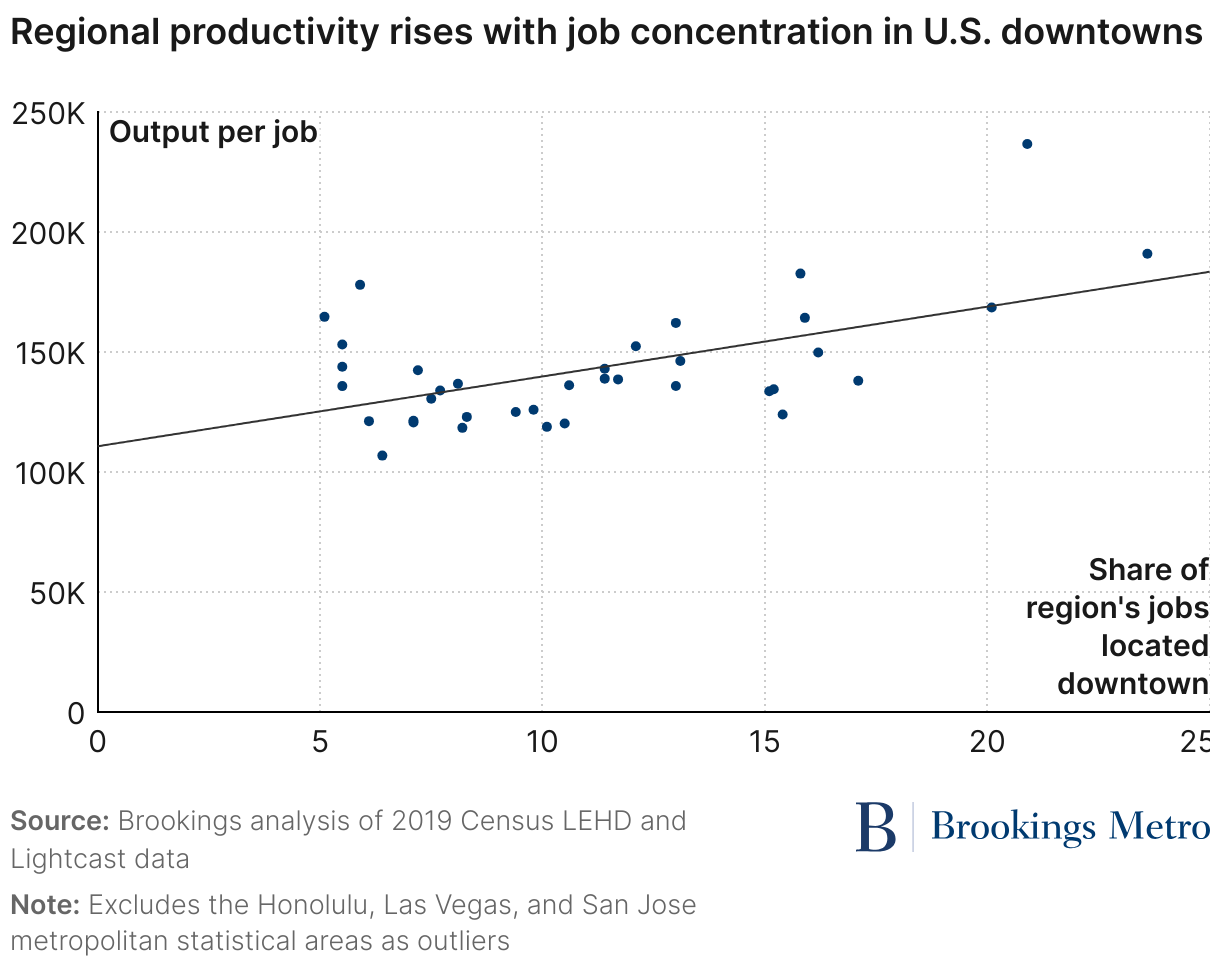
These agglomeration benefits show up in measures of job value. Metropolitan regions that concentrate more of their jobs in activity centers have higher productivity per job. Figure 1 shows the 37 largest U.S. downtowns by number of jobs in 2019, excluding the outliers of San Jose, Las Vegas, and Honolulu.1 There is a strong positive correlation between job concentration in downtown activity centers (on the x axis) and regional productivity (GRP per job on the y axis). The more jobs located in a region’s downtown, the more productive the region is.
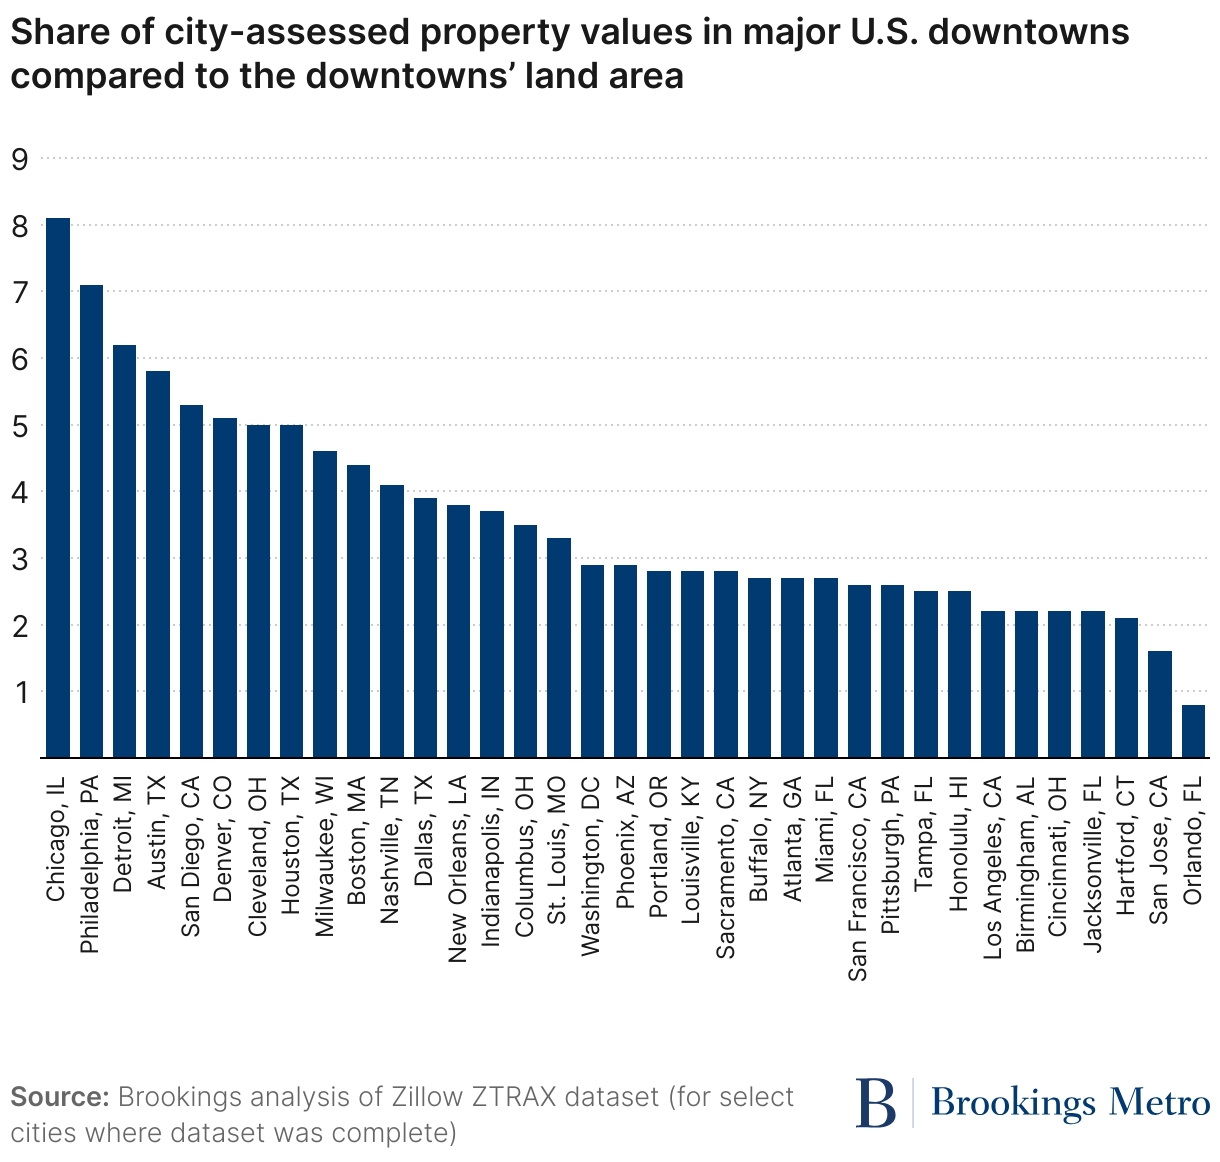
This concentrated productivity effect is also measurable and visualizable in the way that land, labor, and retail markets use downtown land. Taller buildings downtown indicate the high value of land there. However, the extent to which U.S. regions successfully leverage this downtown value varies significantly (see Figure 2), an indication that some regions have more to lose from their downtowns becoming weaker just as some have much to gain from unlocking the value of their downtowns.
The pandemic: A sudden collective action that unplugged the downtown fiscal machine
Agglomeration is the superpower of downtowns and other activity centers. But the disruptions of the pandemic caused many to believe that it might also be their kryptonite. Hyperconcentration of office workers, for instance, created very high exposure to sudden shifts in office utilization trends that reduced downtowns’ “daytime populations,” also known as “commuter-adjusted populations.”
The median major U.S. downtown concentrates 11% of all jobs in a region.2 Some of those workers come from outside the city’s boundaries: those commuting workers and city residents who also have jobs located in the city add up to the daytime population. In 2019, the average major U.S. city’s daytime population was 1.6 times the resident worker population. In other words, 64% of the jobs in the average major U.S. city were held by workers who lived outside the jurisdiction.3 For some cities with above average downtowns by these metrics, the economic disruption of the pandemic has been relatively more profound.
With the rise of remote and hybrid work, employers, workers, and others are asking: are dense office clusters needed to capture agglomeration’s productivity effects? After all, going online also makes it easy to search, reduces the cost of communication, and (at a small coordination cost per interaction) eliminates the cost of travel. The market’s loud answer is shown in Figure 3: office vacancy rates are climbing.
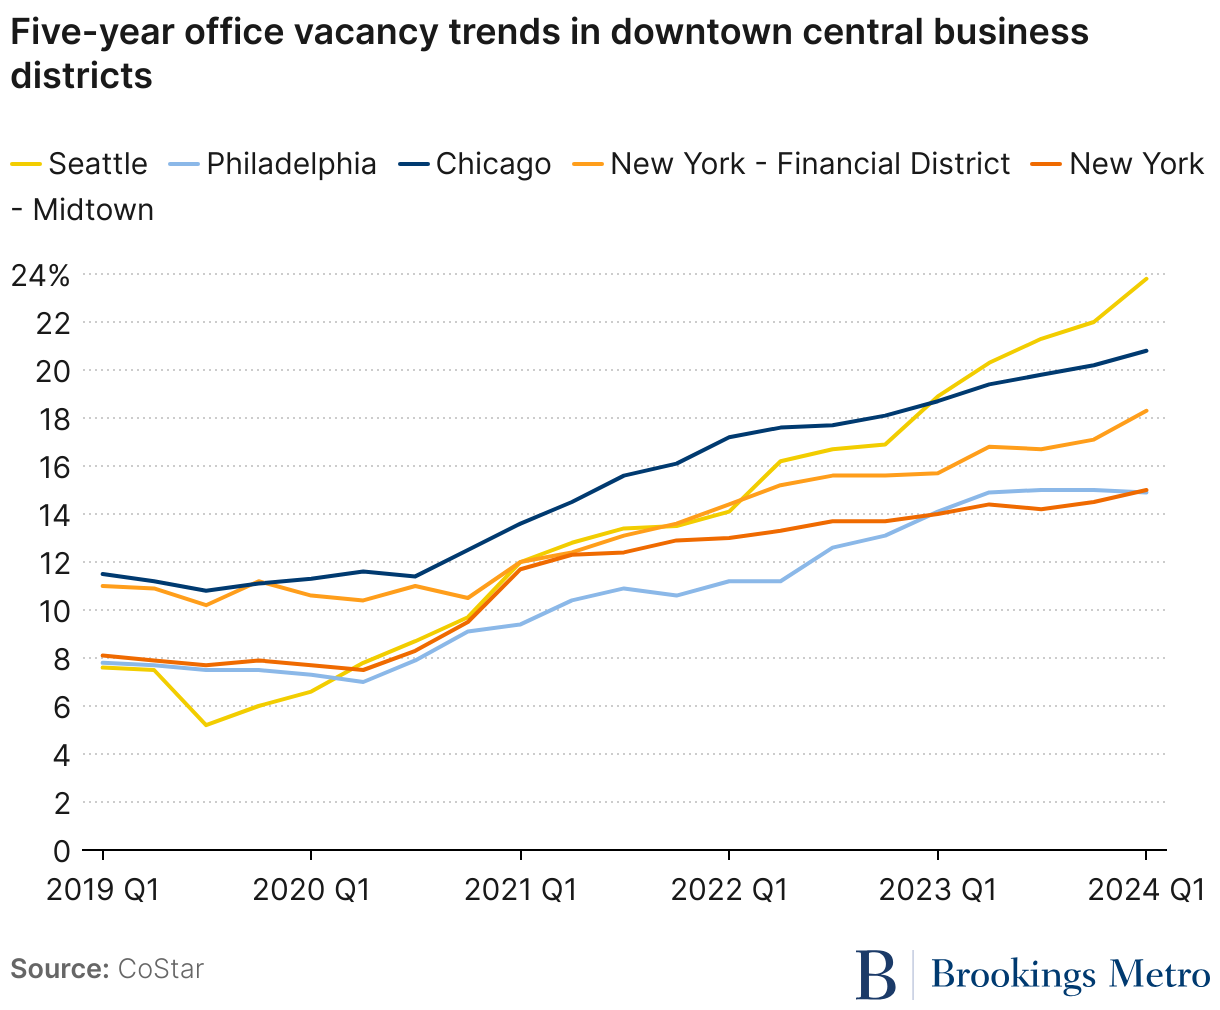
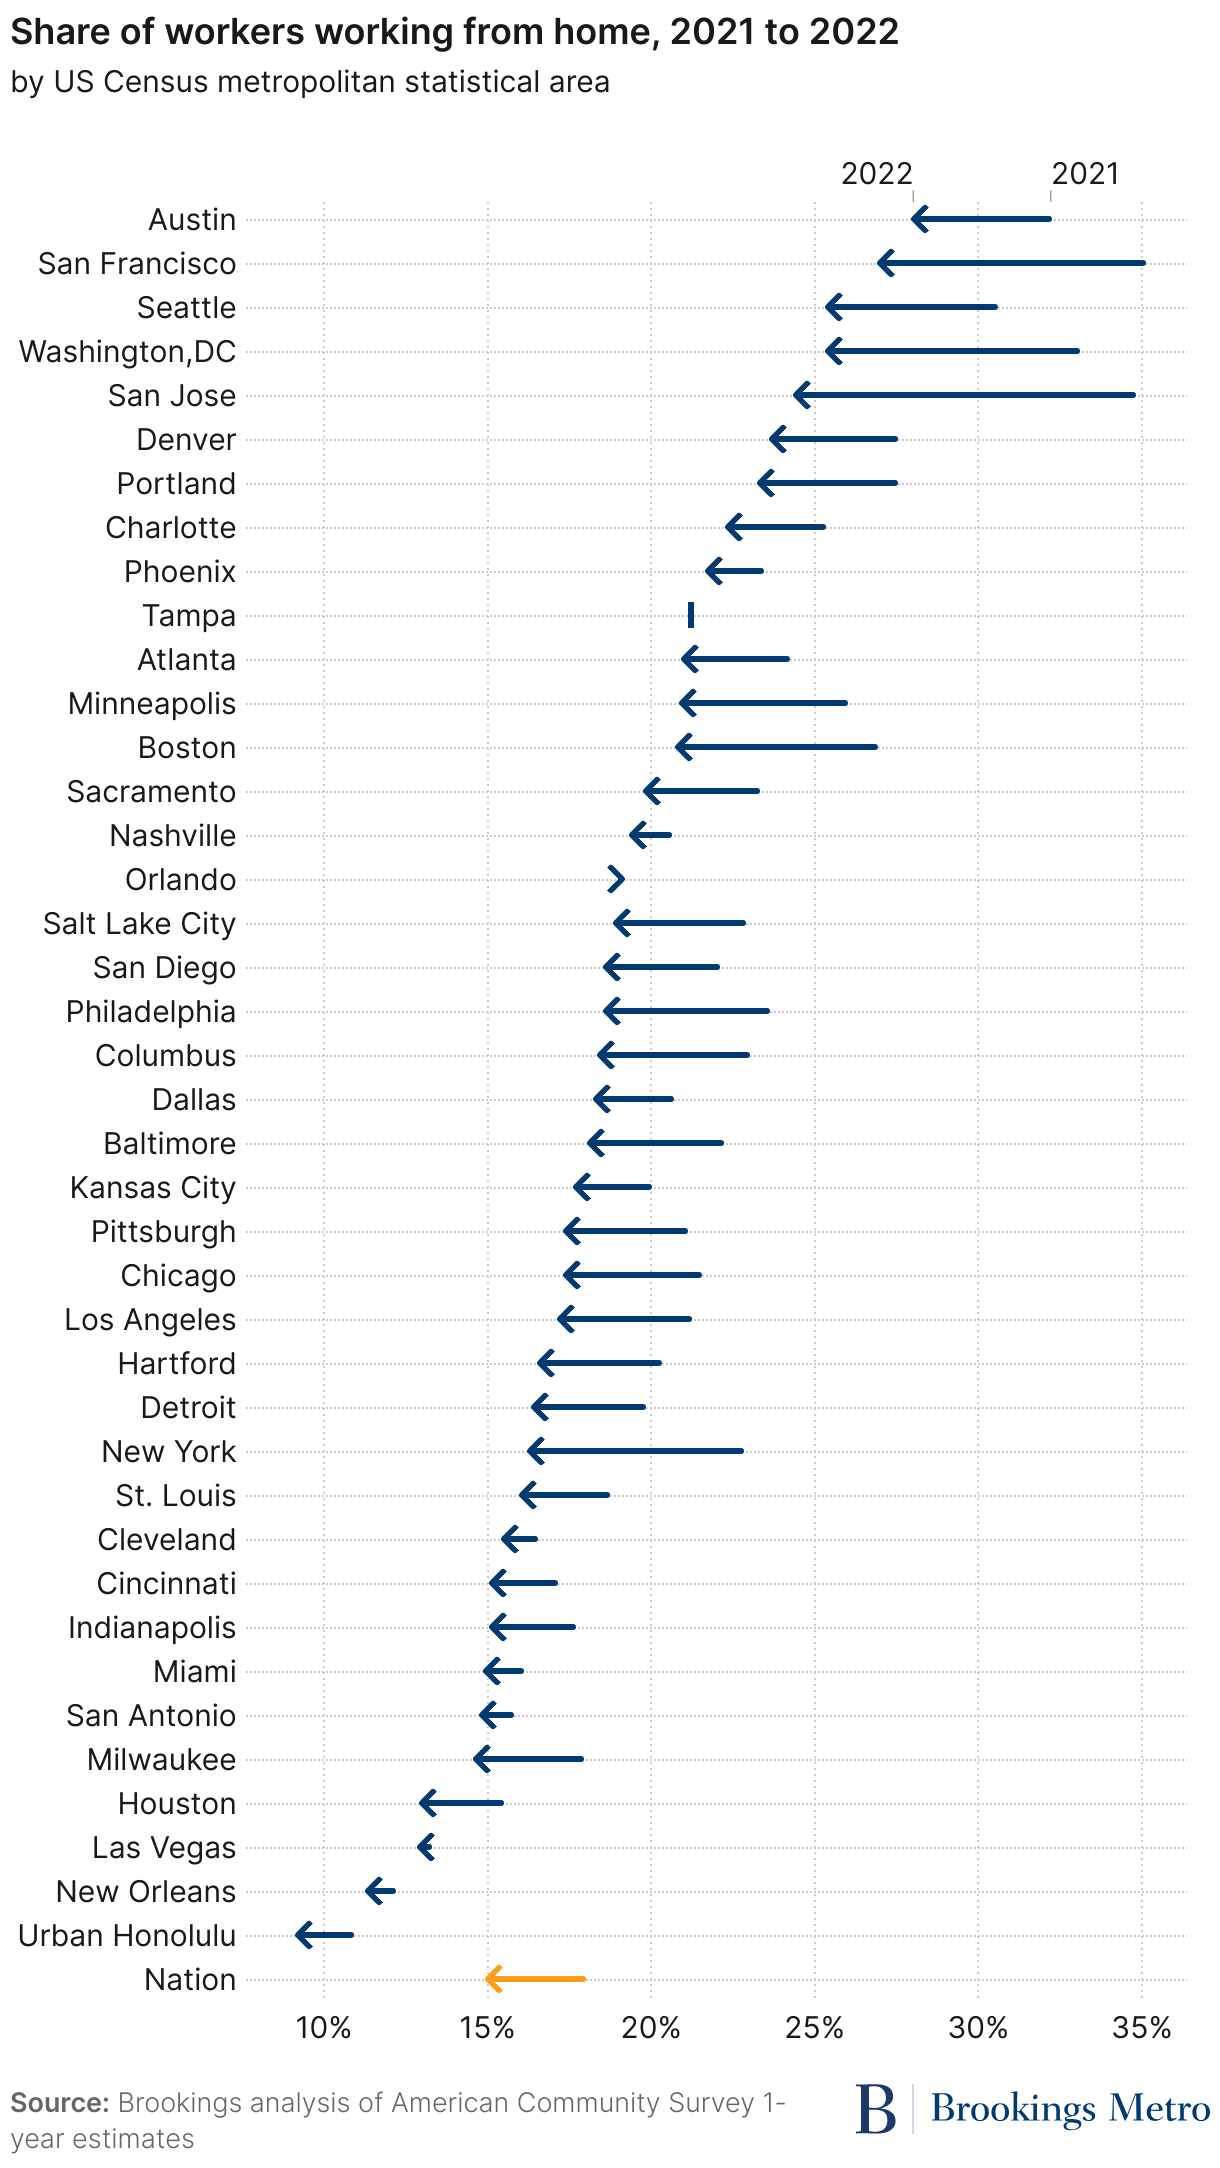
Figure 4, however, shows the significant variation in the return-to-office landscape across metro areas. Metro areas with hospitality- and tourism-oriented economies, such as Honolulu, New Orleans, and Las Vegas, have the lowest work-from-home (WFH) rates. At the other end of the spectrum, metro areas with higher rates of remote work in 2021 generally saw larger declines in 2022. The largest declines were in San Jose; San Francisco; Washington, D.C.; Boston; and New York, which all declined at more than twice the major metro average of -3.5%. While this trend suggests some reversion to the mean, the overall pattern shows considerable differences in WFH rates between places like Houston and Milwaukee, on the one hand, and Denver and Austin, on the other—differences that early research suggests is explained by a combination of job sector mix and average commute times.
Across the board, hybrid work will still include office utilization. However, what an “office” is for an individual worker is changing. With the surge in demand for flexible offices, modern office space with flexible floor plates is retaining its economic value on a per-square-foot basis, but there is a short-term slump in aggregate demand for such space, alongside a permanent collapse in demand for outdated office layouts: these trends are disrupting overall office valuations and local property tax assessments.
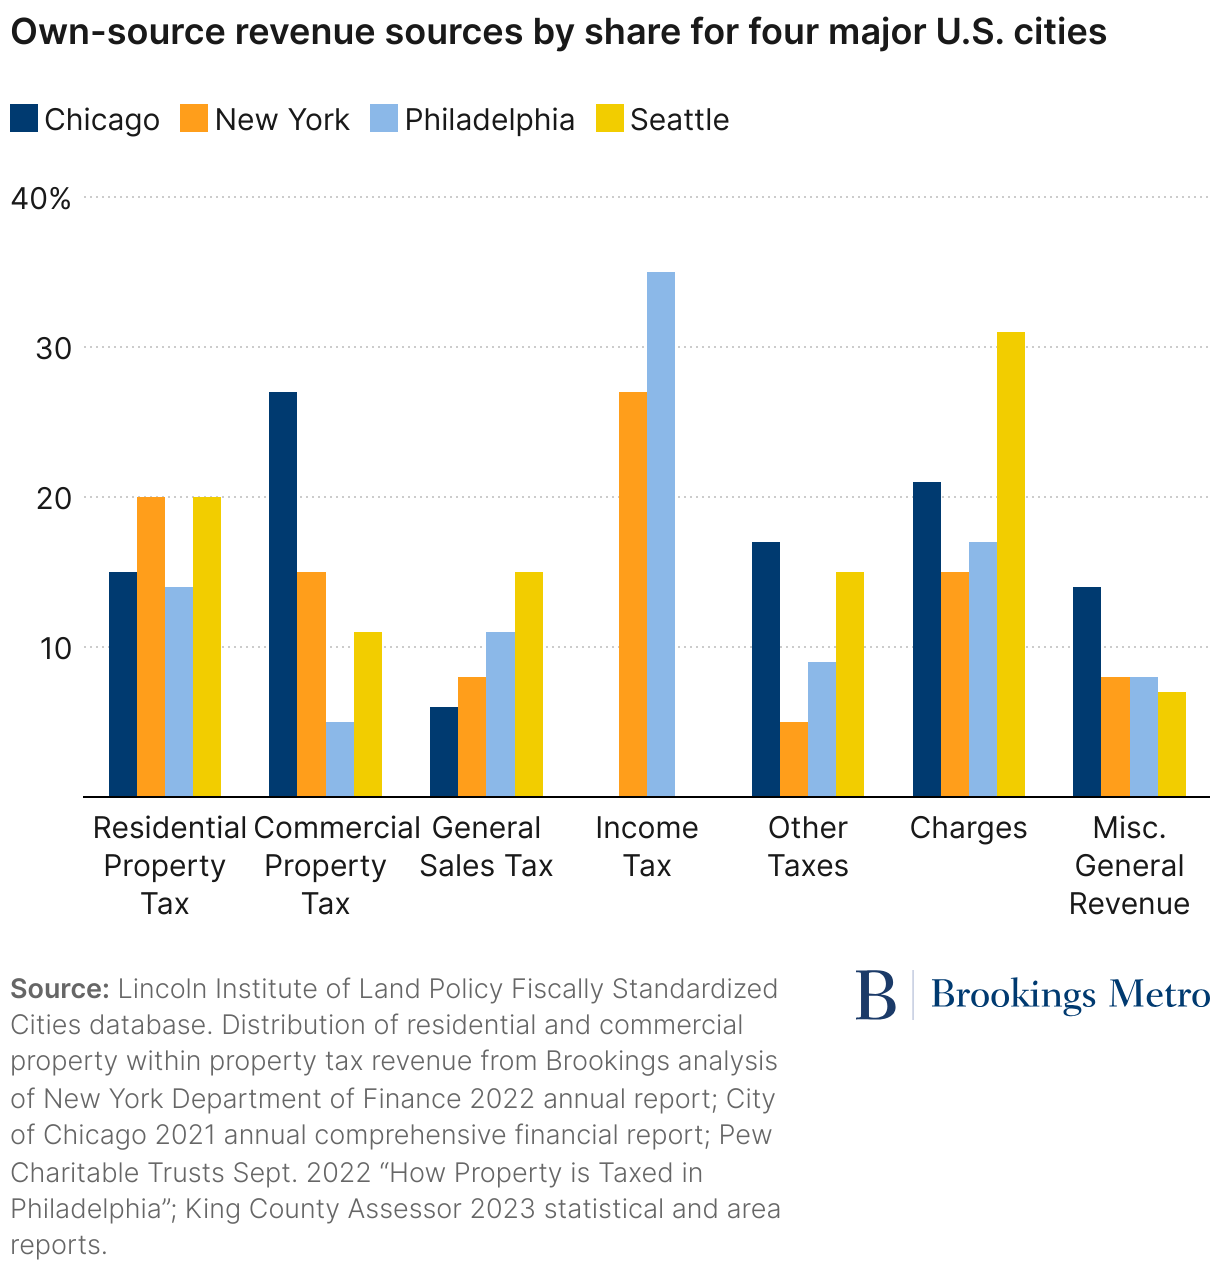
In the long term, there is reason to believe that office markets will eventually right themselves and recover, but in the meantime, the fiscal damage to cities that have high exposure to commercial real estate within their revenue or broader business models will likely be significant.4 The varying importance of commercial real estate to city fiscal structure is shown in Figure 5 for the four cohort cities of this research, backed by complementary analysis with data for 46 additional cities.
In short, local business models that previously adapted to a five-day, in-office work week do not have the capacity to adjust to the lower daytime populations inherent in a shorter in-office work week, with the substantial reduction in business travel and an uneven tourism recovery on top of these trends. These business models include not just local-serving retailers, but also transit systems that rely on fares. The consequence is cascading second-order municipal fiscal effects in terms of lost sales taxes and fare revenue. These fiscal effects have had particular consequences for regional transit systems.
The fallout: Foot traffic, safety, and unsheltered homelessness
Changes in office use patterns, tourism, and visitation have had significant and lingering ramifications for downtown foot traffic beyond fiscal consequences, including heightened concerns about safety and public disorder.
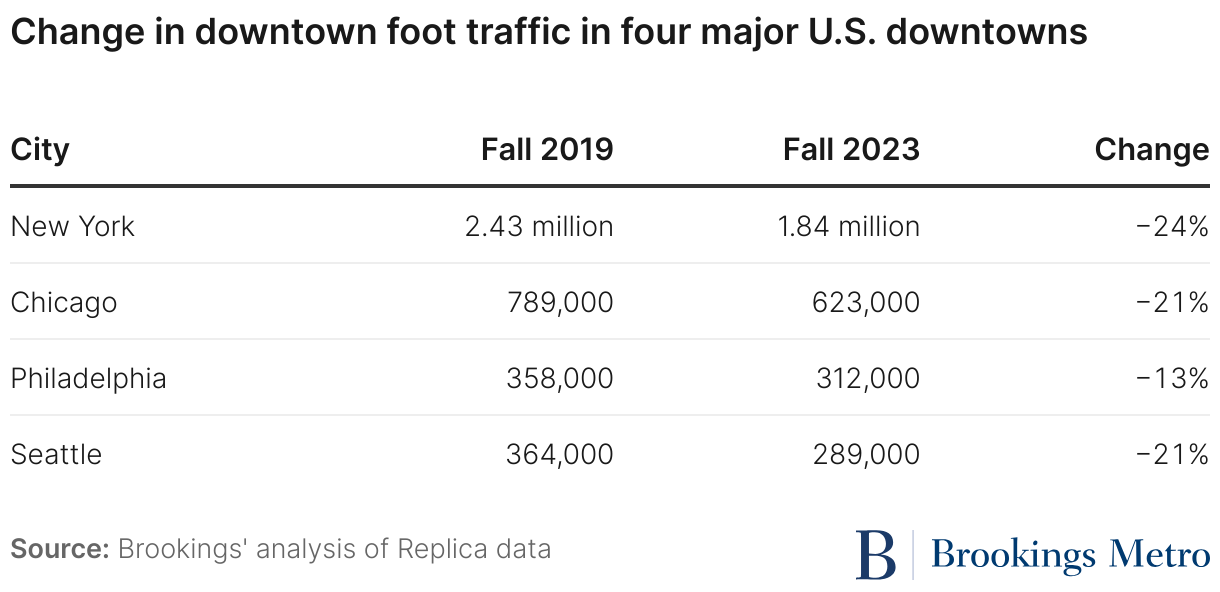
New data from digital cell phone tracking technologies help spell out the scale of downtowns’ foot traffic challenges. In the fall of 2019, there were 2.43 million people in Manhattan south of Central Park on a typical Thursday (see Table 1). By the spring of 2021, this total had collapsed to 1.78 million people, a 27% reduction. The total has moved only slightly since, hitting 1.84 million people in the fall of 2023, the last time period for which data are available. The change in people counts downtown for our cohort cities between the fall of 2019 and the fall of 2023 are shown in Table 1. These double-digit losses in aggregate demand represent an incredibly inefficient use of existing buildings and infrastructure that had been supporting a much larger population just a few years ago.
Along with these fluctuations in downtown foot traffic and activity came new concerns about crime, safety, and public disorder in central business districts—thrusting many place governance and business leaders into the forefront of public safety discourse and decisionmaking. Heightened fear of crime and disorder has also taken on increased political salience for elected officials in the pandemic recovery period, dominating mayoral elections in Chicago, Philadelphia, and other cities nationwide.
Without a doubt, the pandemic recovery period witnessed unusual—and at times, alarming— fluctuations in crime. In 2020, for instance, homicides spiked by nearly 30% to levels not seen since the early 1990s. As a Brennan Center for Justice report found, “violent crime dropped in 2021 and 2022—and then declined again, significantly, in 2023,” and homicides returned to rates comparable to 2005. Property crime trends have been more of a mixed bag, as motor vehicle thefts have risen, and some cities, like New York and Los Angeles, have experienced sharp upticks in shoplifting. Overall, however, shoplifting and retail theft are down in most places, including in cities like San Francisco, with data refuting widespread narratives of increases.
Despite the positive trend lines for declines in crime since 2021, perception does not always catch up with reality, and heightened fear of crime remains a salient issue for downtown and municipal leaders alike. Indeed, Americans’ perceptions of crime long have been out-of-step with the reality of crime trends: Gallup polling over the past 25 years consistently shows that Americans believe crime is up, even when it’s down. The disruptions wrought by the pandemic—including diminished foot traffic, increased financial precarity, and fewer opportunities for social interaction—likely contributed to heightened fear of crime in the years since, even with historic declines in 2023.
U.S. cities are also under increased pressure to address homelessness, particularly in downtown central business districts—which are often the most visible hubs for people experiencing homelessness to gather and access services. Data confirm the urgency of this imperative nationwide, as the U.S. witnessed a striking 12% increase in homelessness between 2022 and 2023, with a 15% increase in major cities.
Despite this grim national picture, however, glimmers of hope remain. Our analysis found that, in nine out of the 44 major cities that completed full point-in-time counts in 2023, homelessness rates either remained stable or declined between 2022 and 2023, with rates in Austin, Texas; Raleigh, North Carolina; Indianapolis; and Colorado Springs, Colorado, declining by more than 10 percentage points. Major metros in Texas have also made significant progress, with the Houston metropolitan area achieving the lowest rate of homelessness of any major U.S. city.
Downtown decline hurts everyone, especially low-income essential workers
The implications of diminished downtown office activity for retail, hospitality, and other support-sector employers and workers are profound. With knowledge economy workers now spending more time in their home neighborhoods than in their office locations, the markets for food prepared outside the home and other daily needs and desires have diffused and shifted in space.
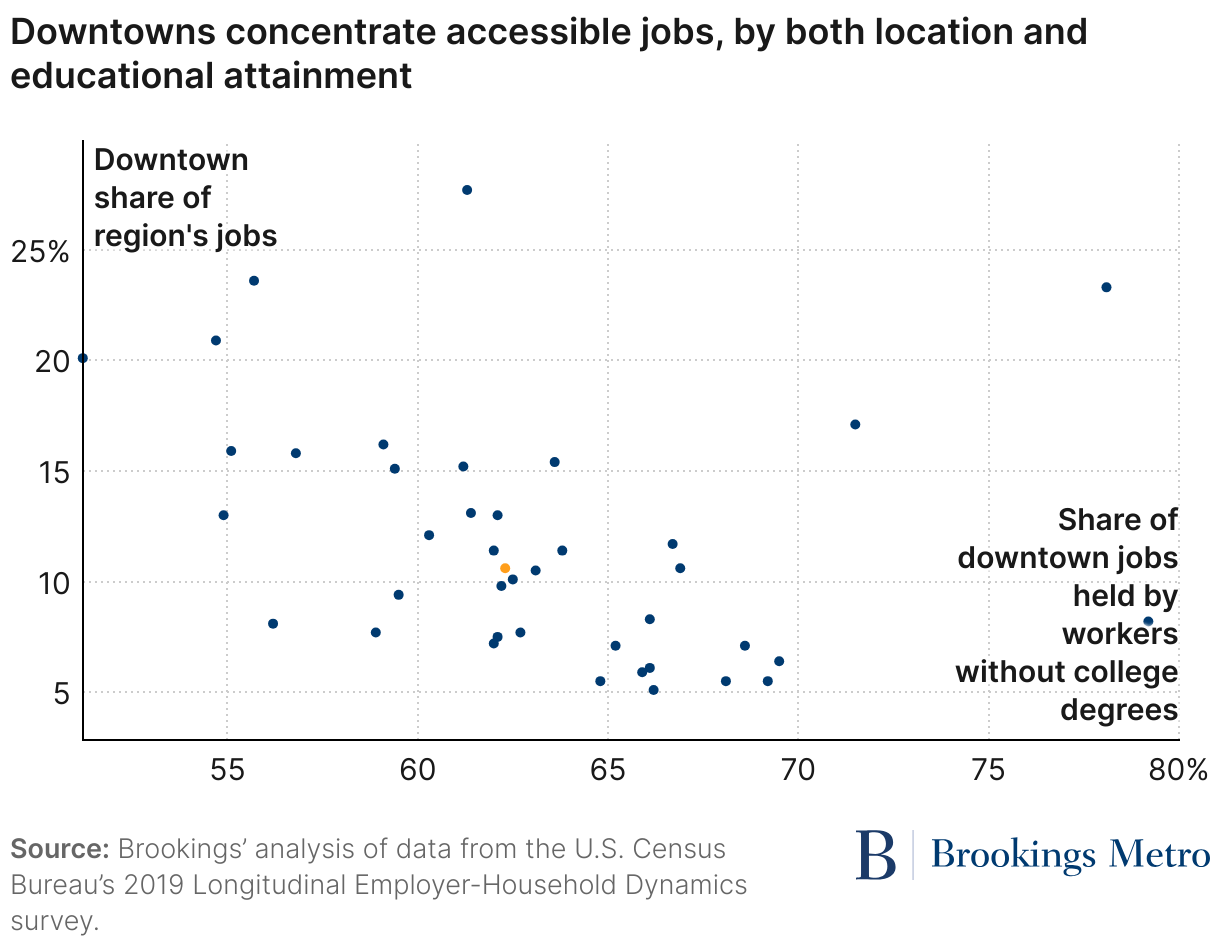
Before the pandemic, downtowns were clusters not just of high-paying knowledge economy jobs but also of accessible support-sector jobs that paid an income premium relative to the region as a whole. In 2019, the median major U.S. downtown (the 40 largest downtowns by job count) clustered 11% of its region’s jobs on 0.1% of its region’s land area.5 For all 40 major downtowns, more than half of those jobs did not require a college degree (see Figure 6). Dispersing office employment dislocates these support jobs. In some cases, this creates long and expensive commutes for essential workers who can least afford them, as illustrated by the poignant story of the employees of a San Francisco salad shop, as told by Conor Dougherty and Emma Goldberg in The New York Times. In other cases, the jobs are lost altogether and replaced by precarious gig work as delivery and ride-hailing services replace walkable retail and transit-oriented jobs.
These disruptions have the potential to drastically exacerbate regional inequality. Figure 7 shows that, as the economy started to emerge from the pandemic in 2022, a 25-percentage-point gulf that existed in 2012 remained between employment rates in the highest and lowest income census tracts of the average major metropolitan area. With their geographic location at the center of regions, downtowns are uniquely positioned to address geographic inequality—and doing so can in turn strengthen their locational advantage and broaden their coalition.
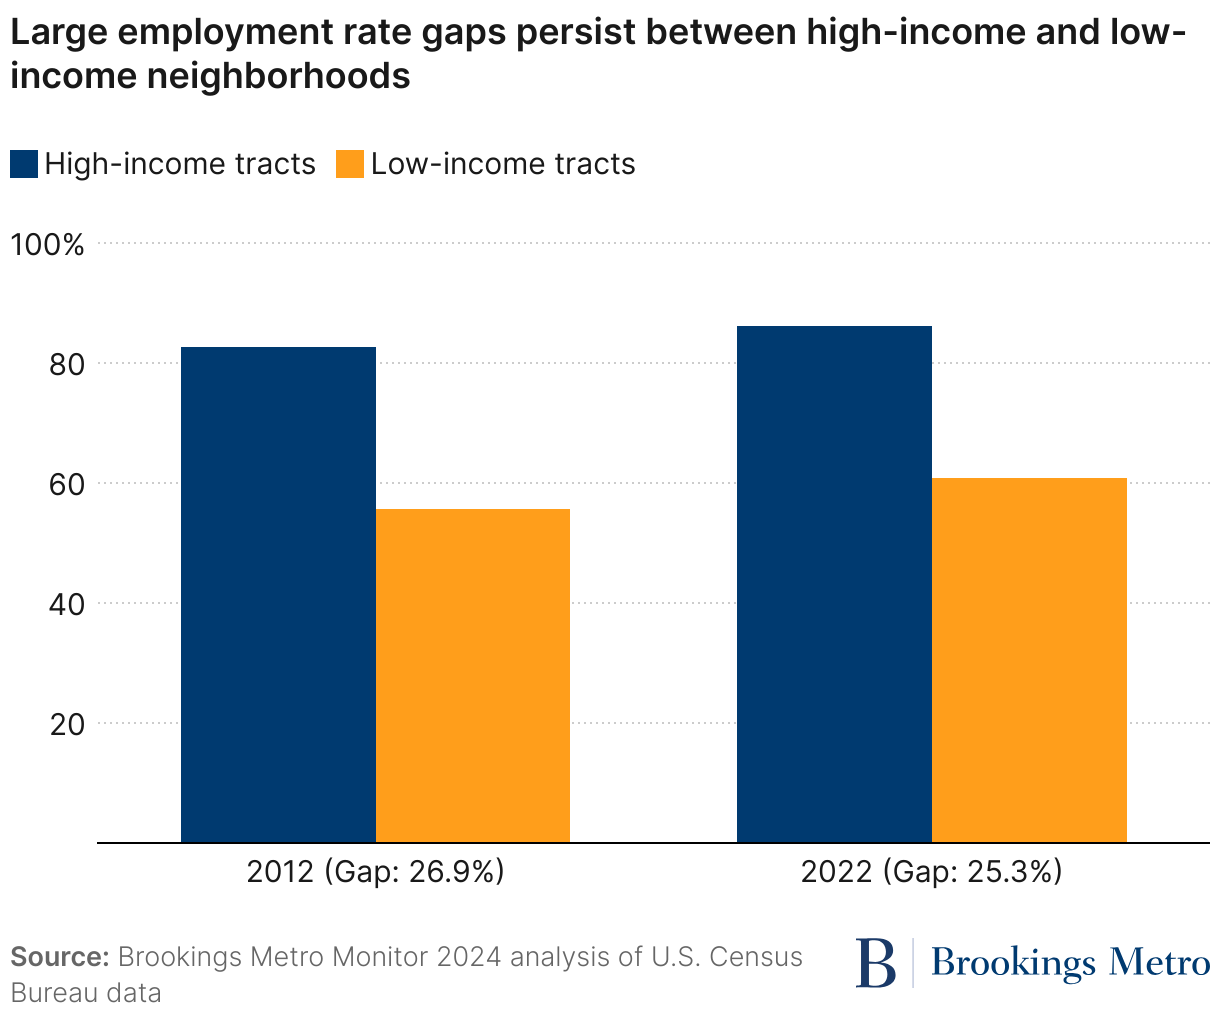
Within this challenge, there is an opportunity for downtowns to leverage the power of agglomeration to offer a broader group of city residents economic opportunities beyond the service sector.
Policy recommendations: Seven ways downtowns can rebuild through shared prosperity
There is no going back in time to 2019. Downtowns will need to adapt to remain relevant, and building the political coalition needed to support any change will require downtowns to more directly serve not just their most traditional stakeholders, but everyone who lives in cities.
The remainder of this report offers a set of seven data-driven policy recommendations, with specific guidance for public-, private-, and civic-sector leaders to unlock the next generation of inclusive growth anchored in strong downtowns. Policy recommendations are a menu of options that depend on market context and existing city conditions, such as hub-and-spoke transit systems. They must be tailored to place-based realities.
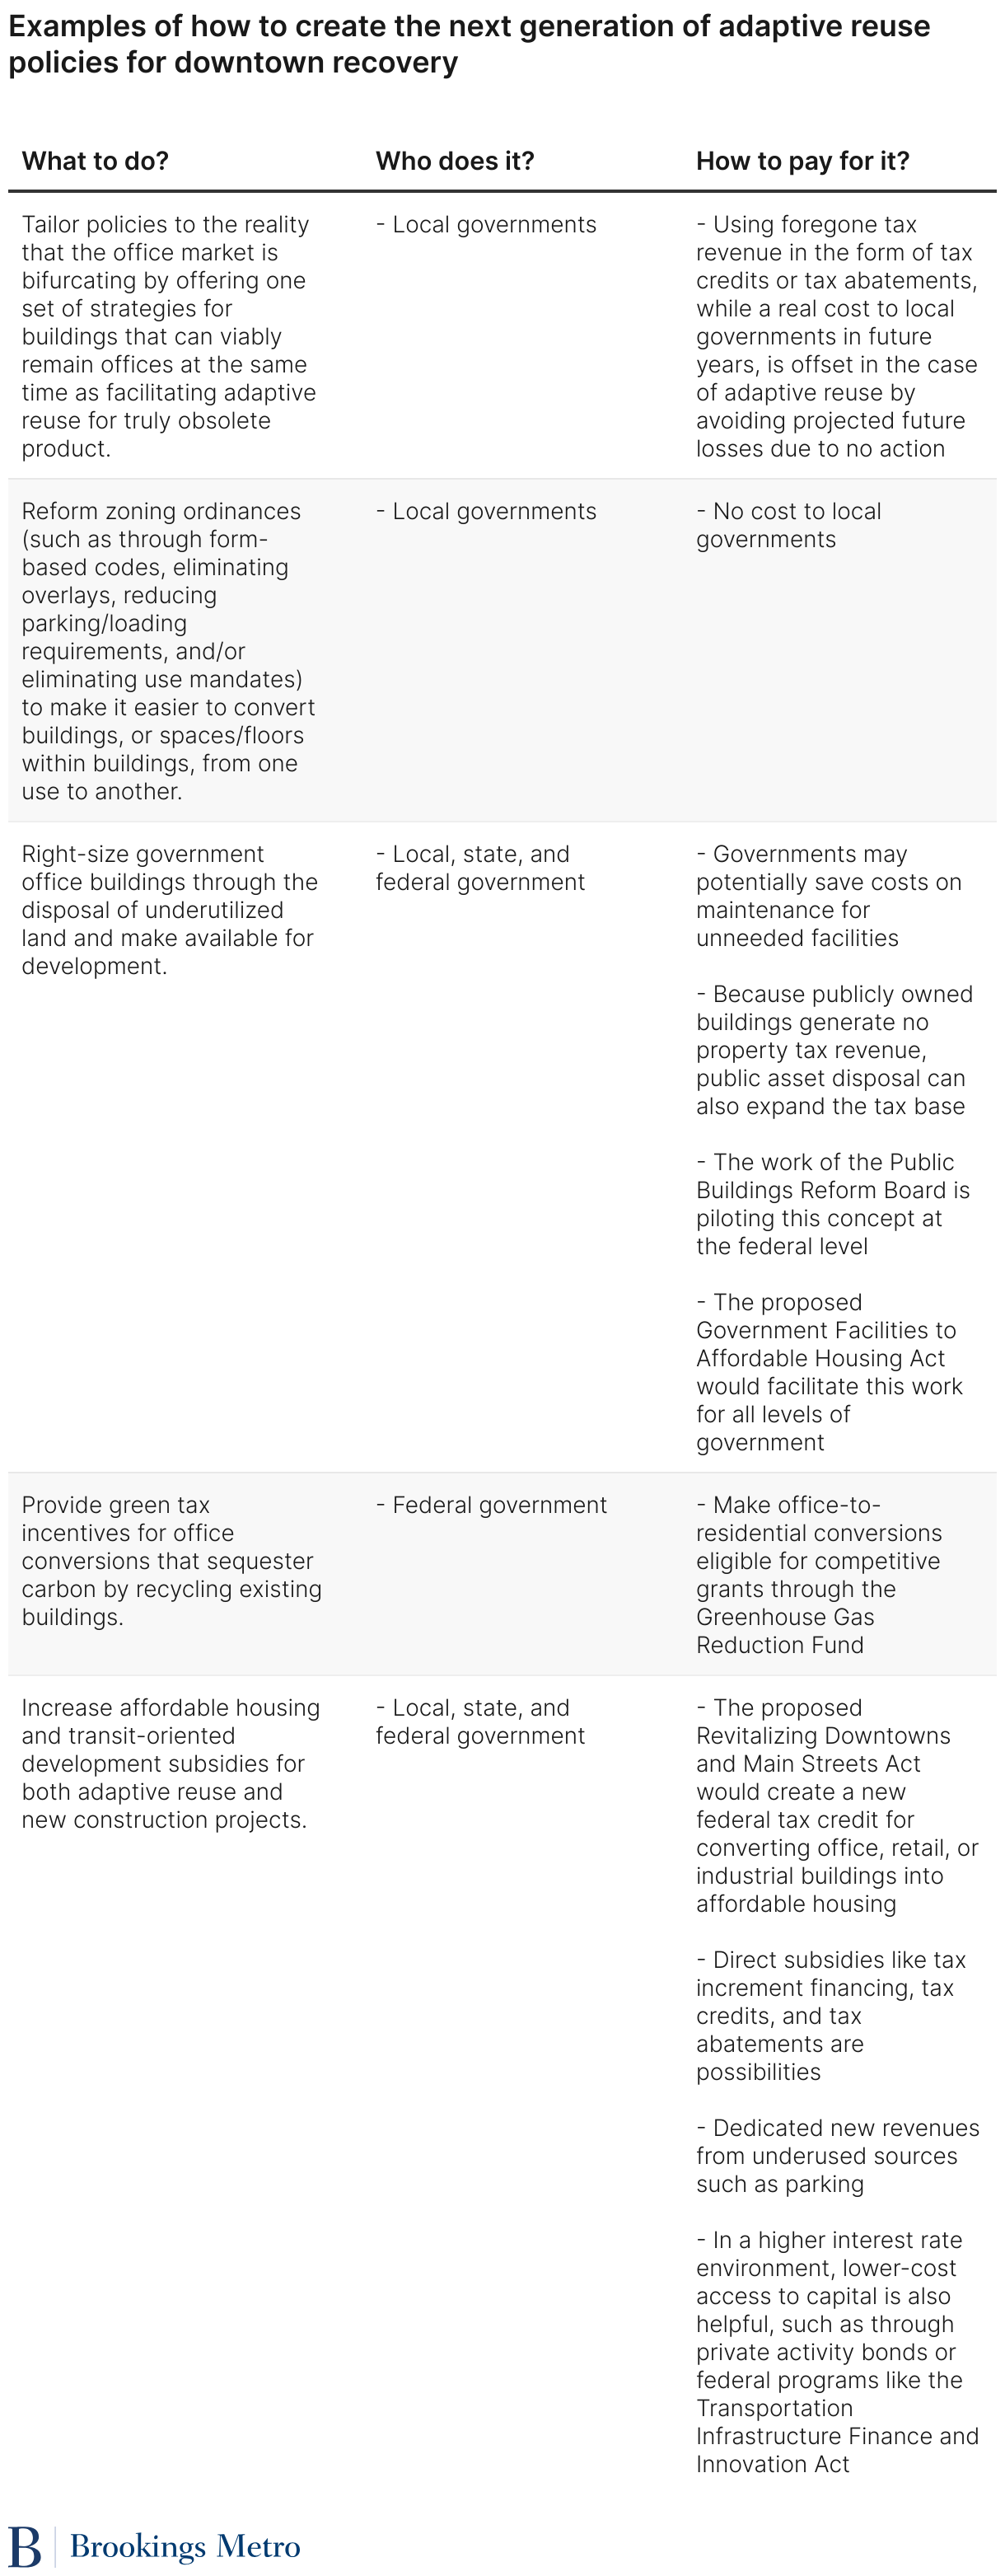
1. Create the next generation of adaptive reuse policies
Removing obsolete office buildings strengthens demand for the remaining buildings. Building more housing near the remaining product has a similar effect, so converting obsolete offices into housing does have a particular elegance. However, there is almost certainly a gap between the amount of slack in the office market currently and the number of office-to-residential conversions that are economically feasible at the current cost of capital in most cities. This means that the office market would benefit from public sector intervention to close that gap.
However, the political coalition supporting public intervention in the downtown commercial real estate market is limited, especially in superstar cities. Therefore, policies to facilitate the adaptation of the built environment to a changing economy and society should be tooled broadly to include many interventions that offer the whole city something while also stabilizing the office market, rather than hyper-focusing on one particular change (converting downtown offices into housing) that targets a very specific set of buildings and their owners (see Table 2).
- M-CORE, New York City: New York City’s policy responses to the challenges facing the office market merit highlighting. First, the city is offering a modest suite of tax incentives that use no existing general fund revenue to promote modernization of struggling office buildings to increase their attractiveness to employers. Among other concessions, the Manhattan Commercial Revitalization Program (M-CORE) program offers building owners a medium-term sales tax exemption on materials used for renovations. In addition to encouraging property owners to invest in their assets for the long term, such a program has the potential to stabilize components of the tax base (rather than risking decline), increase office utilization (and thus foot traffic), and promote transit. In fact, the program is targeted to buildings within almost the exact same geographic area as the proposed-but-stalled congestion pricing zone.
- City of Yes for Economic Opportunity, New York City: In terms of adaptive reuse, New York’s City of Yes for Economic Opportunity proposal demonstrates a modern political approach to the case for liberalizing policies that constrain commercial development. The proposal is framed as one that benefits small businesses in neighborhood commercial corridors, and it contains real policy proposals that offer meaningful value to this city-wide constituency. In the same package, reforms to allow strategic uses currently confined to industrial areas within the city to office zones offer the double benefit of reducing economic pressure on the city’s dwindling industrial areas that are needed for logistics and also shifting activity into office zones that need diversified demand. Only after rolling out the M-CORE program to upgrade office buildings and “City of Yes” proposals to make it easier to convert offices into other commercial uses does the City of Yes for Housing Opportunity offer policy proposals to convert offices into housing.
- La Salle Reimagined, Chicago: The LaSalle Reimagined initiative in Chicago is also notable as the “most generous” direct infusion of public capital to convert offices into housing in the U.S. The initiative will bring the next wave of adaptive reuse to the Loop in a newly inclusive way through office-to-residential conversion with major affordable housing commitments. It is worth noting that the housing affordability crisis is a major component of what is motivating voters’ concern about the economy, and economic development plans that do not address affordability feel unresponsive and out of touch. Even after a change of mayors, the new mayor, Brandon Johnson, and his administration in Chicago found a compromise path forward that right-sized the LaSalle Reimagined program for the city’s budget reality while preserving the 30% affordable vision.
2. Diversify the job mix downtown, while creating and/or strengthening equitable pathways to opportunity industries for all residents
Office-using employment will continue, but given the structural reduction in demand for support services, cities need new ways to strengthen the availability of good and promising jobs in and around downtowns. This is not just an argument for equity and inclusion: place-based workforce development investments to establish and grow diverse pathways in job sectors concentrated in downtowns can directly address labor shortages and can lower costs by increasing the predictability and reliability of talent recruitment, thus making downtowns more attractive locations for employers and strengthening aggregate office demand.
Allowing or facilitating the growth of creative and hospitality-oriented sectors of the economy that activate downtowns on nights and weekends is a complementary strategy that may also indirectly boost office demand. Empowering the creative and hospitality sectors has a dual impact of reaching more people for employment while also creating more dynamic and diverse downtowns as destinations. This can be as simple as investing in high-quality public spaces and refining and formalizing temporary adaptations from the pandemic that reallocated portions of public streets to outdoor dining (see Table 3). Music audits are a more expansive strategy that has demonstrated promise and has the uniting benefit of serving both downtowns and neighborhoods.
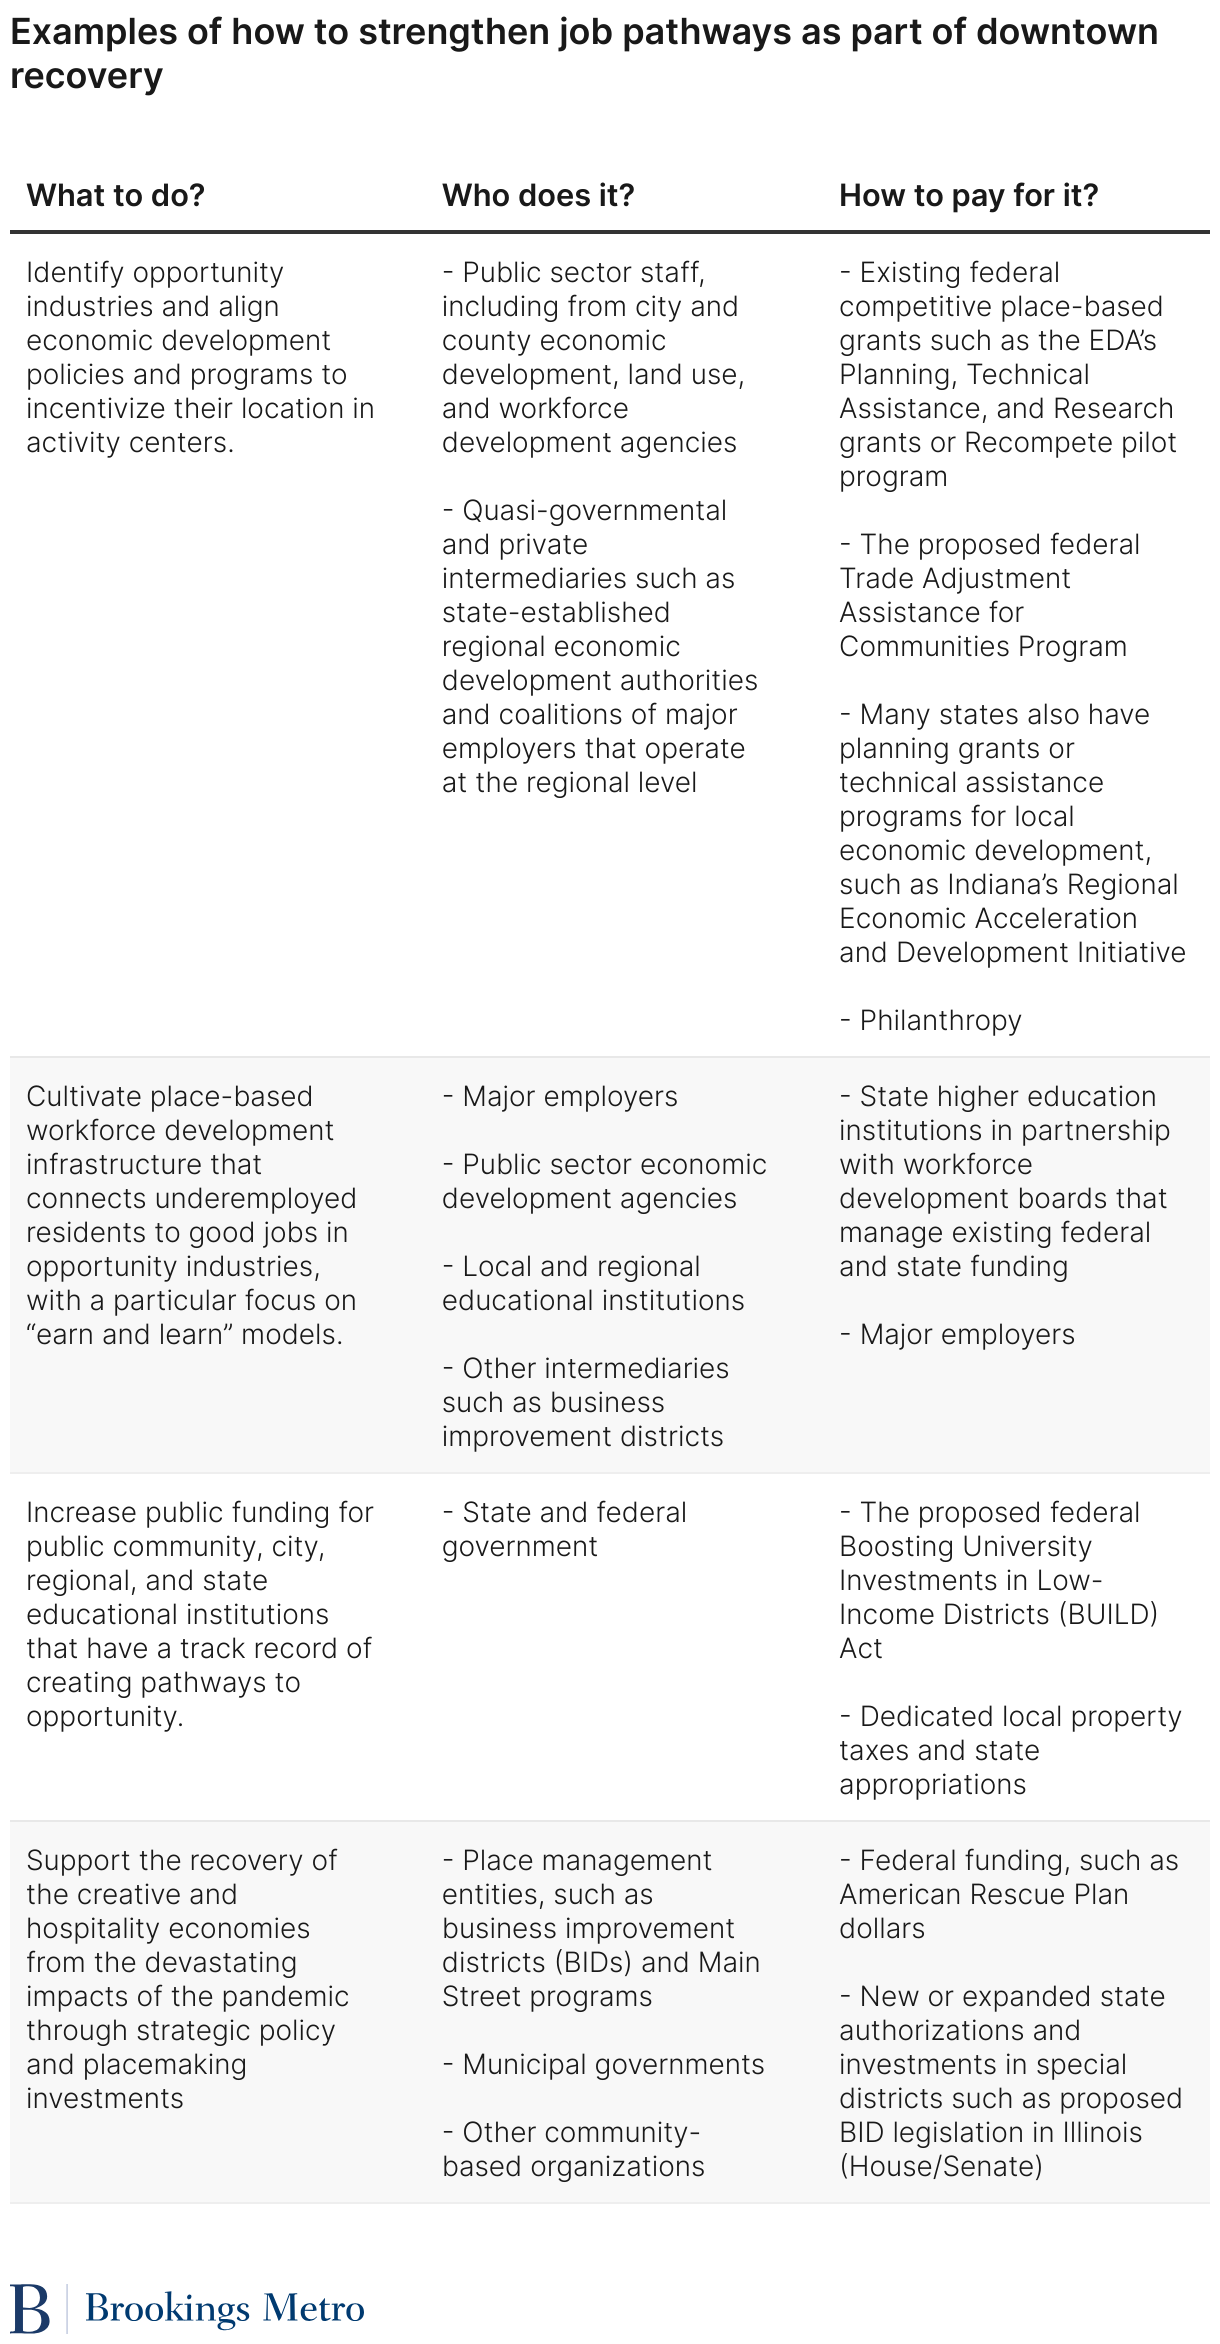
Even prior to the pandemic, some place-based economic development approaches were finding success with strengthening accessible job pathways, including:
- The West Philadelphia Skills Initiative: In Philadelphia, the University City District’s West Philadelphia Skills Initiative has worked since it began as a small pilot in 2009 to connect residents of West Philadelphia, almost all of whom are Black, to jobs at local anchor institutions and major employers. As the program has refined its model, demonstrated success, and grown, it now serves over 200 residents per year with training and relationships to a range of industries including childcare, construction, education, government, medicine, landscaping, and transportation.
- Northland Workforce Training Center, Buffalo, New York: In western New York, Empire State Development (the state’s umbrella economic development financing entity) partnered with the University at Buffalo Regional Institute (a research center at the University at Buffalo, the state’s flagship public university) and State University of New York (SUNY) Erie Community College and SUNY Alfred State College to create the Northland Workforce Training Center. The center serves over 300 students per year, largely drawn from Buffalo’s east side neighborhoods, where 72.9% of the residents are Black. The program has rapidly established a track record of high graduation rates and high placement rates in advanced manufacturing and energy careers.
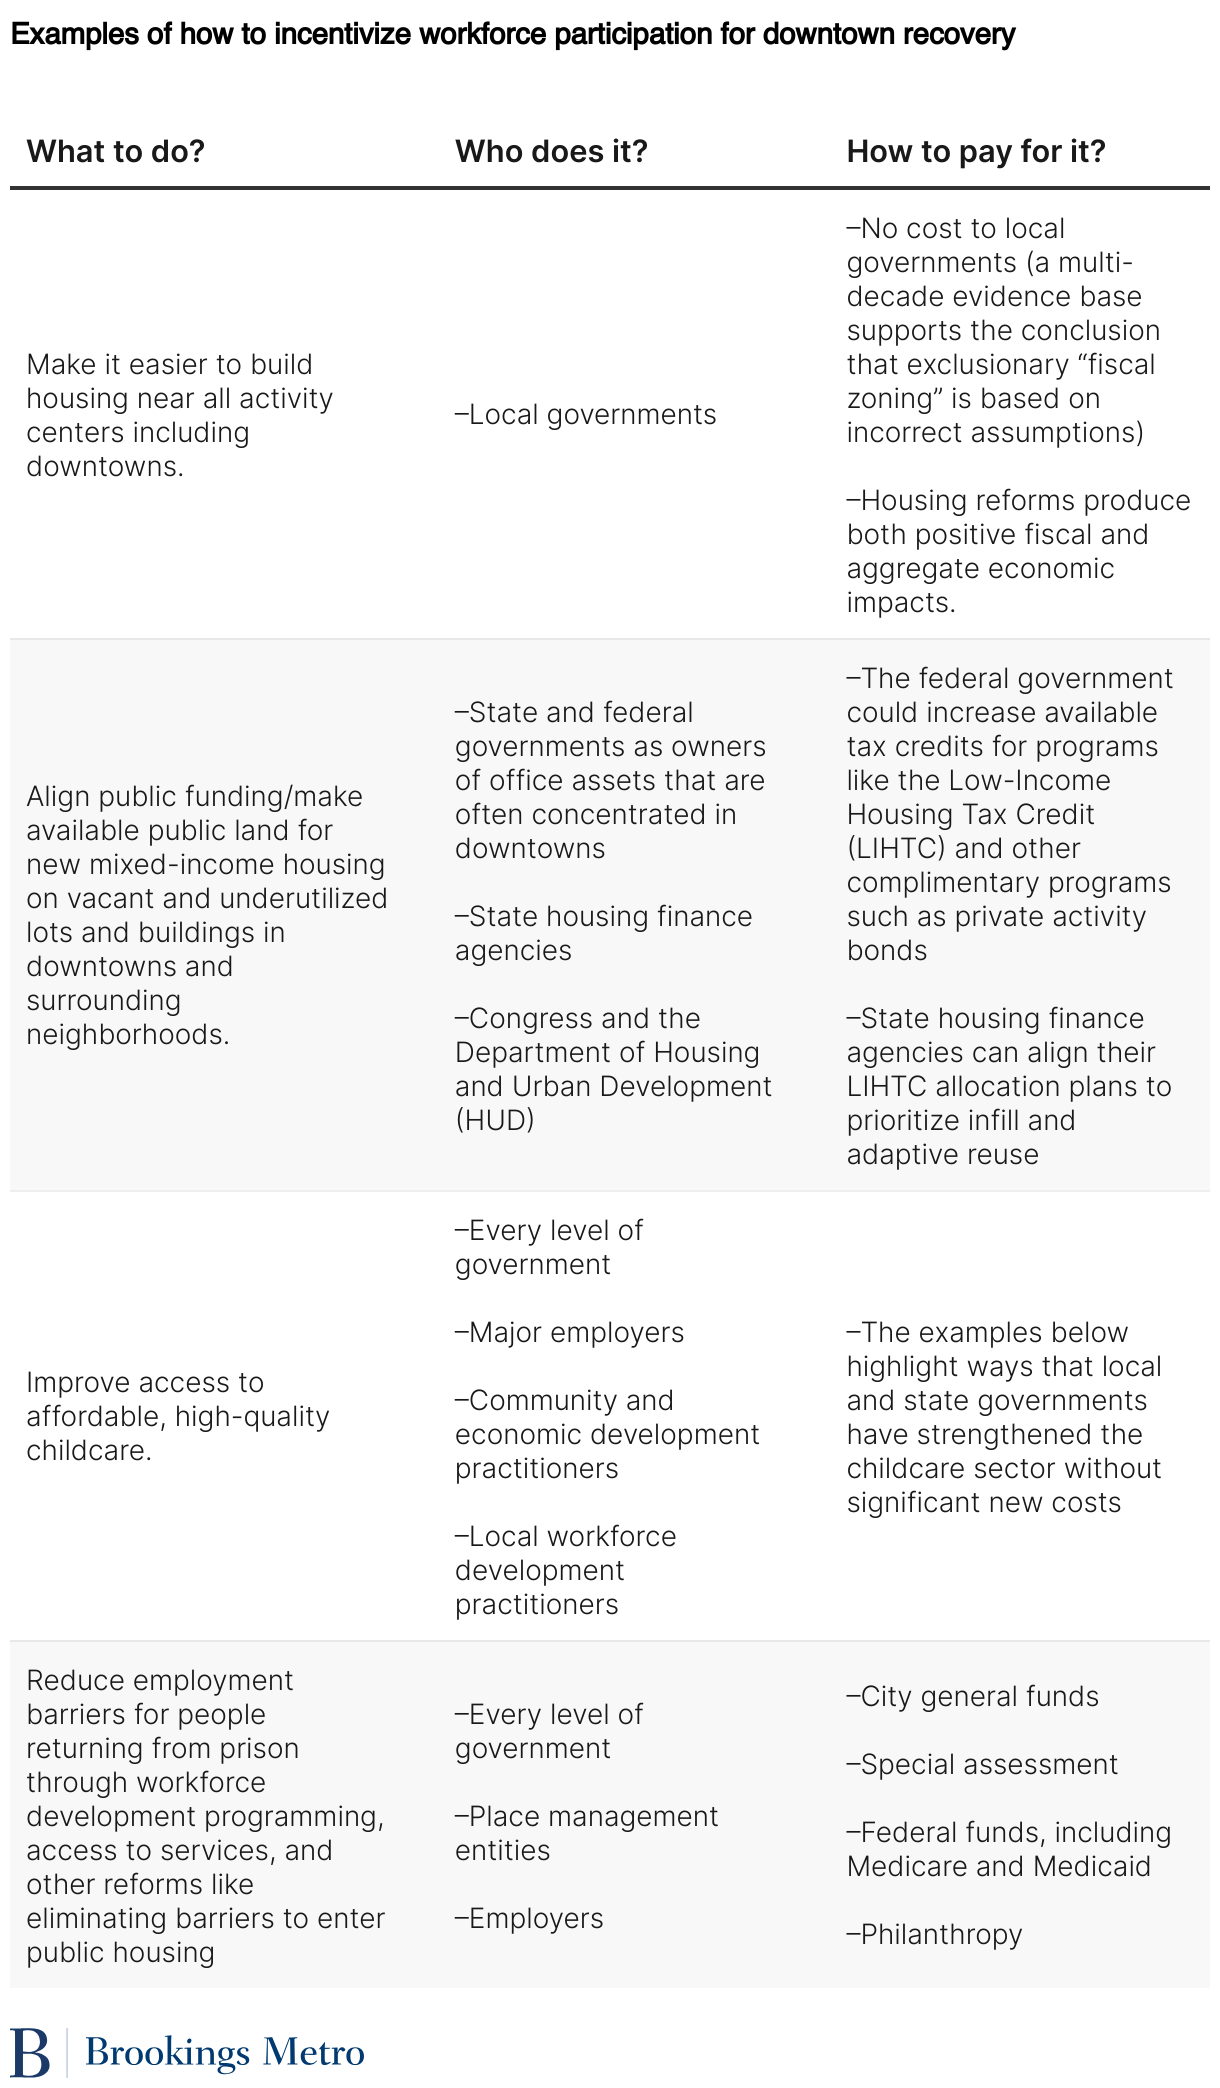
3. Make downtowns more livable for more workers
Policies that make it easier and more attractive to work downtown can create broad-based benefits for a wide spectrum of workers. This section highlights three policies that can be programmatically connected to downtown recovery and that directly address racial and geographic gaps in workforce participation. First, in high-cost metropolitan areas, the cost of housing near jobs is a barrier to work. Second, the availability of affordable, high-quality daycare for young children can both encourage office utilization by knowledge economy workers and workforce participation by single mothers. And finally, bolstering workforce development, housing, and other reentry supports for returning citizens, in particular, represents a cost-effective tool to both staff downtown ambassador programs and increase safety.
Housing as workforce development
Building more housing near jobs directly addresses the top two costs borne by U.S. households: housing and transportation. Nationwide, a shortage of somewhere between 1.7 and 7.3 million homes is a core driver of the housing affordability crisis. In the average major U.S. metropolitan area, a slim majority of rental housing is located in the suburbs, while a majority of office inventory is in cities (see Figure 8). This geographic distribution of built environment inventory is a window into the jobs-housing spatial mismatch that has been getting worse in recent decades and lengthening commute times. Long commutes are a costly drain on productivity for employers and human well-being for workers. Expanding housing supply near jobs can slow housing cost growth and shorten commutes. And these positive effects for workers are also good for cities: they can strengthen demand for offices in downtown areas by making it easy to build housing both in and around downtowns.
Childcare as workforce development
Prior to the pandemic, childcare costs were growing even faster than housing costs. While the large majority of operational costs in the childcare sector are salaries, topping out at 63% for infant care, that still leaves 37% or more of costs as opportunities to help the sector either pay workers better wages, charge parents less, or a combination of both. And now, childcare supply has gone down even as costs have continued to surge. Despite these financial realities, women with young children are actually leading the labor market recovery, and evidence suggests that the widespread availability of telework is a key reason why. However, this leaves out women with lower levels of education who are less likely to have telework-ready jobs and also limits the ability of working mothers to access the benefits of in-person work. The childcare crisis is ongoing and must be addressed.
Reentry as workforce development
The lack of training, workforce, and other reentry supports for people returning from prison represents a significant barrier to economic justice and recovery—as more than half of formerly incarcerated people do not secure “stable employment” within a year of being released. A strong body of evidence demonstrates that skill development, housing, mentorship, and other social services can significantly improve employment outcomes for returning citizens, while also improving public safety and reducing homelessness (see Table 4). Given the promising track record of place governance entities like BIDs in partnering as workforce development partners for returning citizens, there is strong potential for downtowns to advance greater workforce participation and support for people returning from prison—if they have the resources they need to do so.
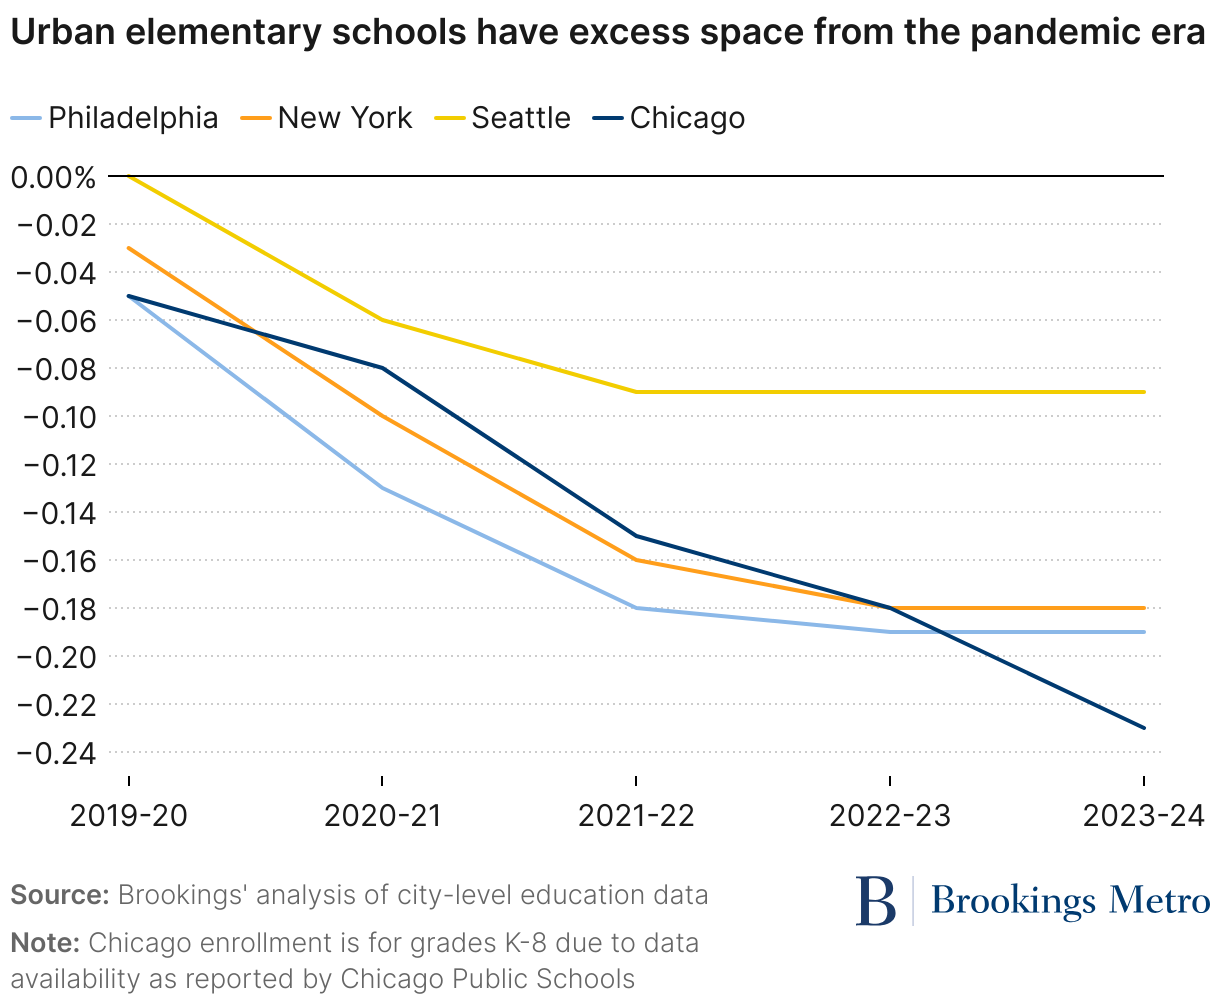
Cities and states are bringing creative ideas to every category of covering childcare operation costs, and multiple states have taken steps to improve access to health care coverage for childcare workers. In Colorado, shared services networks have shown promise in addressing administrative costs, the second-biggest cost factor after labor. Cities in Texas are adopting new property tax credits for daycares. Seattle and New York have revised zoning, and California has streamlined licensing to reduce barriers to entry when starting or siting a new daycare. Finally, making available publicly owned facilities for childcare centers is a common strategy, and the recent impacts of the pandemic have made available two obvious new possible sources of space: surplus government offices and public schools. The latter is a particularly logical option, as school buildings are already designed for use by children, and, as shown in Figure 9, urban elementary school enrollment suffered major declines during the pandemic that have partially stabilized but have not reversed.
4. Address crime, and perceptions of crime, with data-driven and place-conscious safety policies that correspond with place-based crime patterns
Unfortunately, some policymakers have responded by crafting policy that responds to perceptions of crime, rather than the data of where and how crime actually occurs, with significant costs to municipal budgets and residents of color. New York City, for instance, spent over $155 million in overtime pay for police officers to enhance subway patrols, which had a negligible effect on crime reduction and led to significant increases in arrests of people of color.
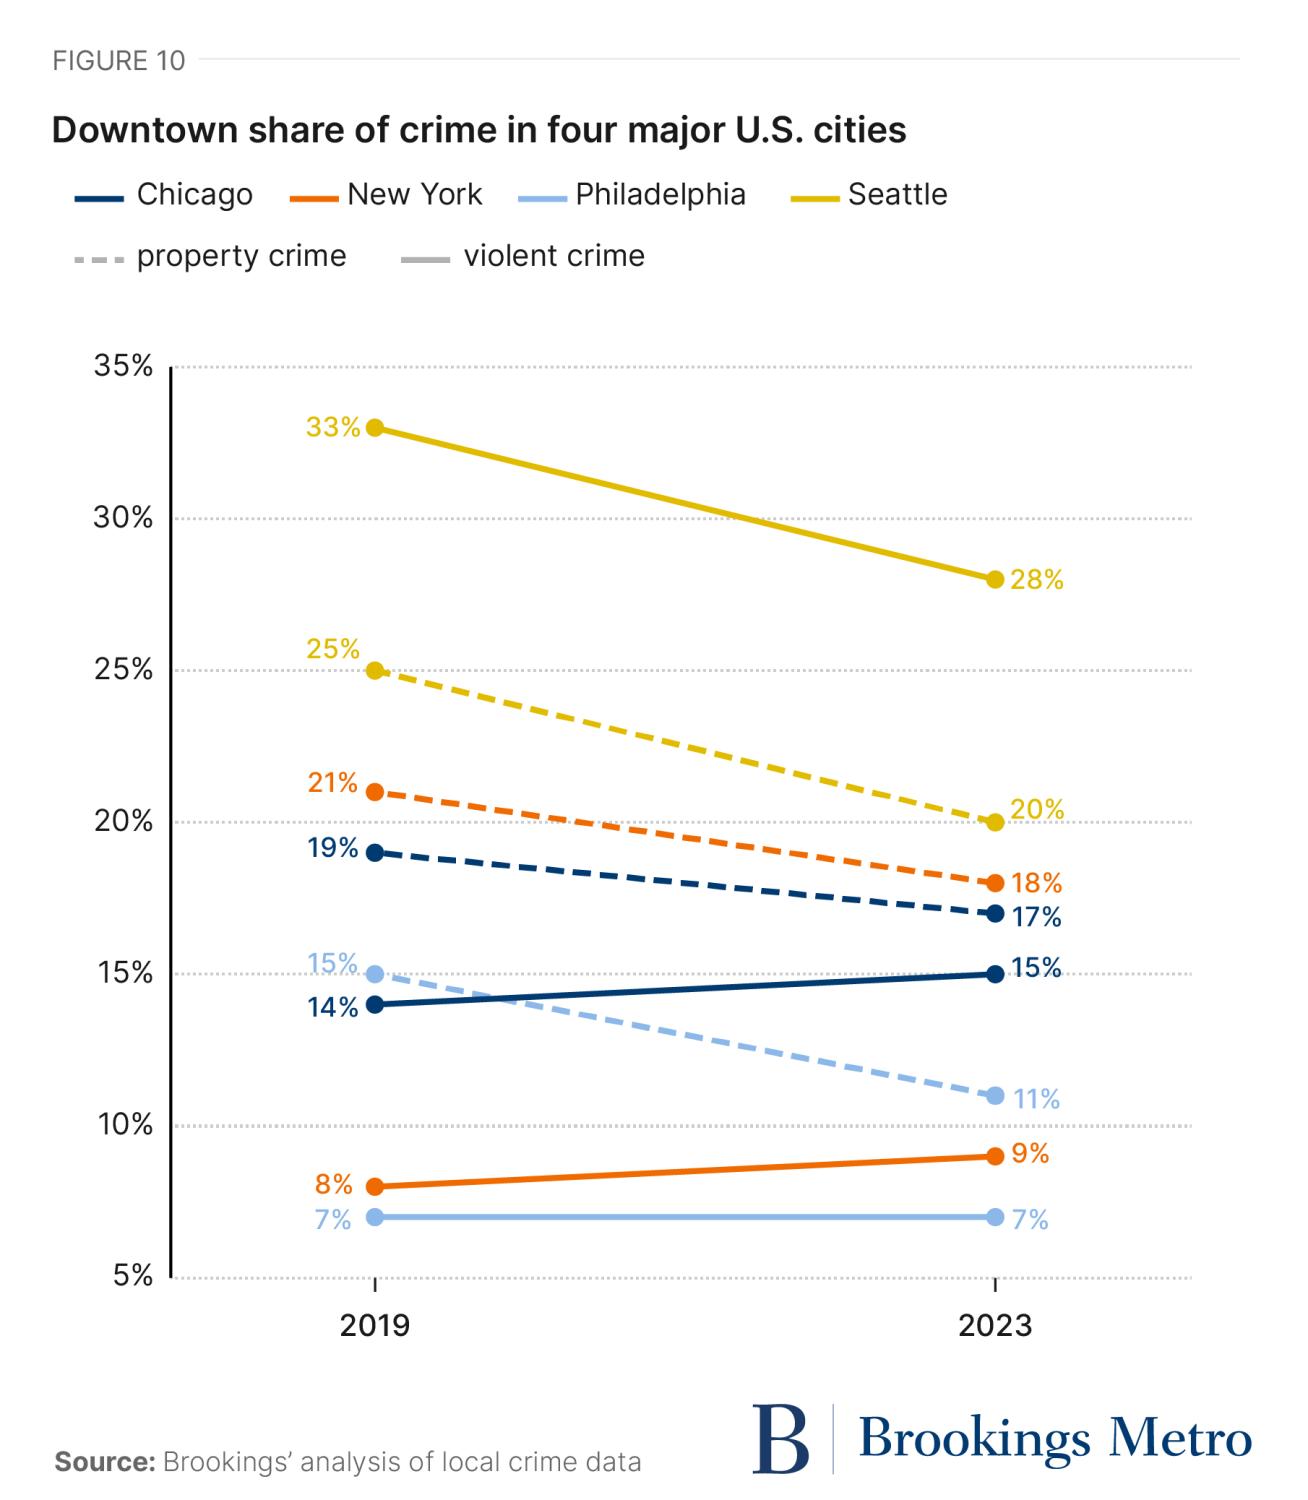
Rather than allowing perceptions alone to drive decisionmaking, local leaders can—and should—respond to rising fears of crime with evidence-based policies that match where, why, and how crime actually occurs within cities. Our analysis found that across cities, downtowns are some of the safest places for residents to live, work, and play. As Figure 10 shows, the share of citywide crime that occurs downtown has declined since the pandemic in some of the nation’s largest cities.
Cities, of course, still have significant concerns about crime outside of downtown areas, as violent crime, in particular, concentrates in lower-income neighborhoods with histories of disinvestment and racial segregation. Understanding the spatial distribution of crime within cities is crucial because safety solutions are not universal—what works to reduce certain crimes downtown may not work in other areas suffering from generations of disinvestment and segregation. And while there are evidence-based solutions that can improve safety across entire cities (such as enhancing access to economic opportunity, behavioral health care, and third spaces), public- and private-sector leaders must heed data and evidence when employing them to be effective in reducing crime and stewarding public dollars.
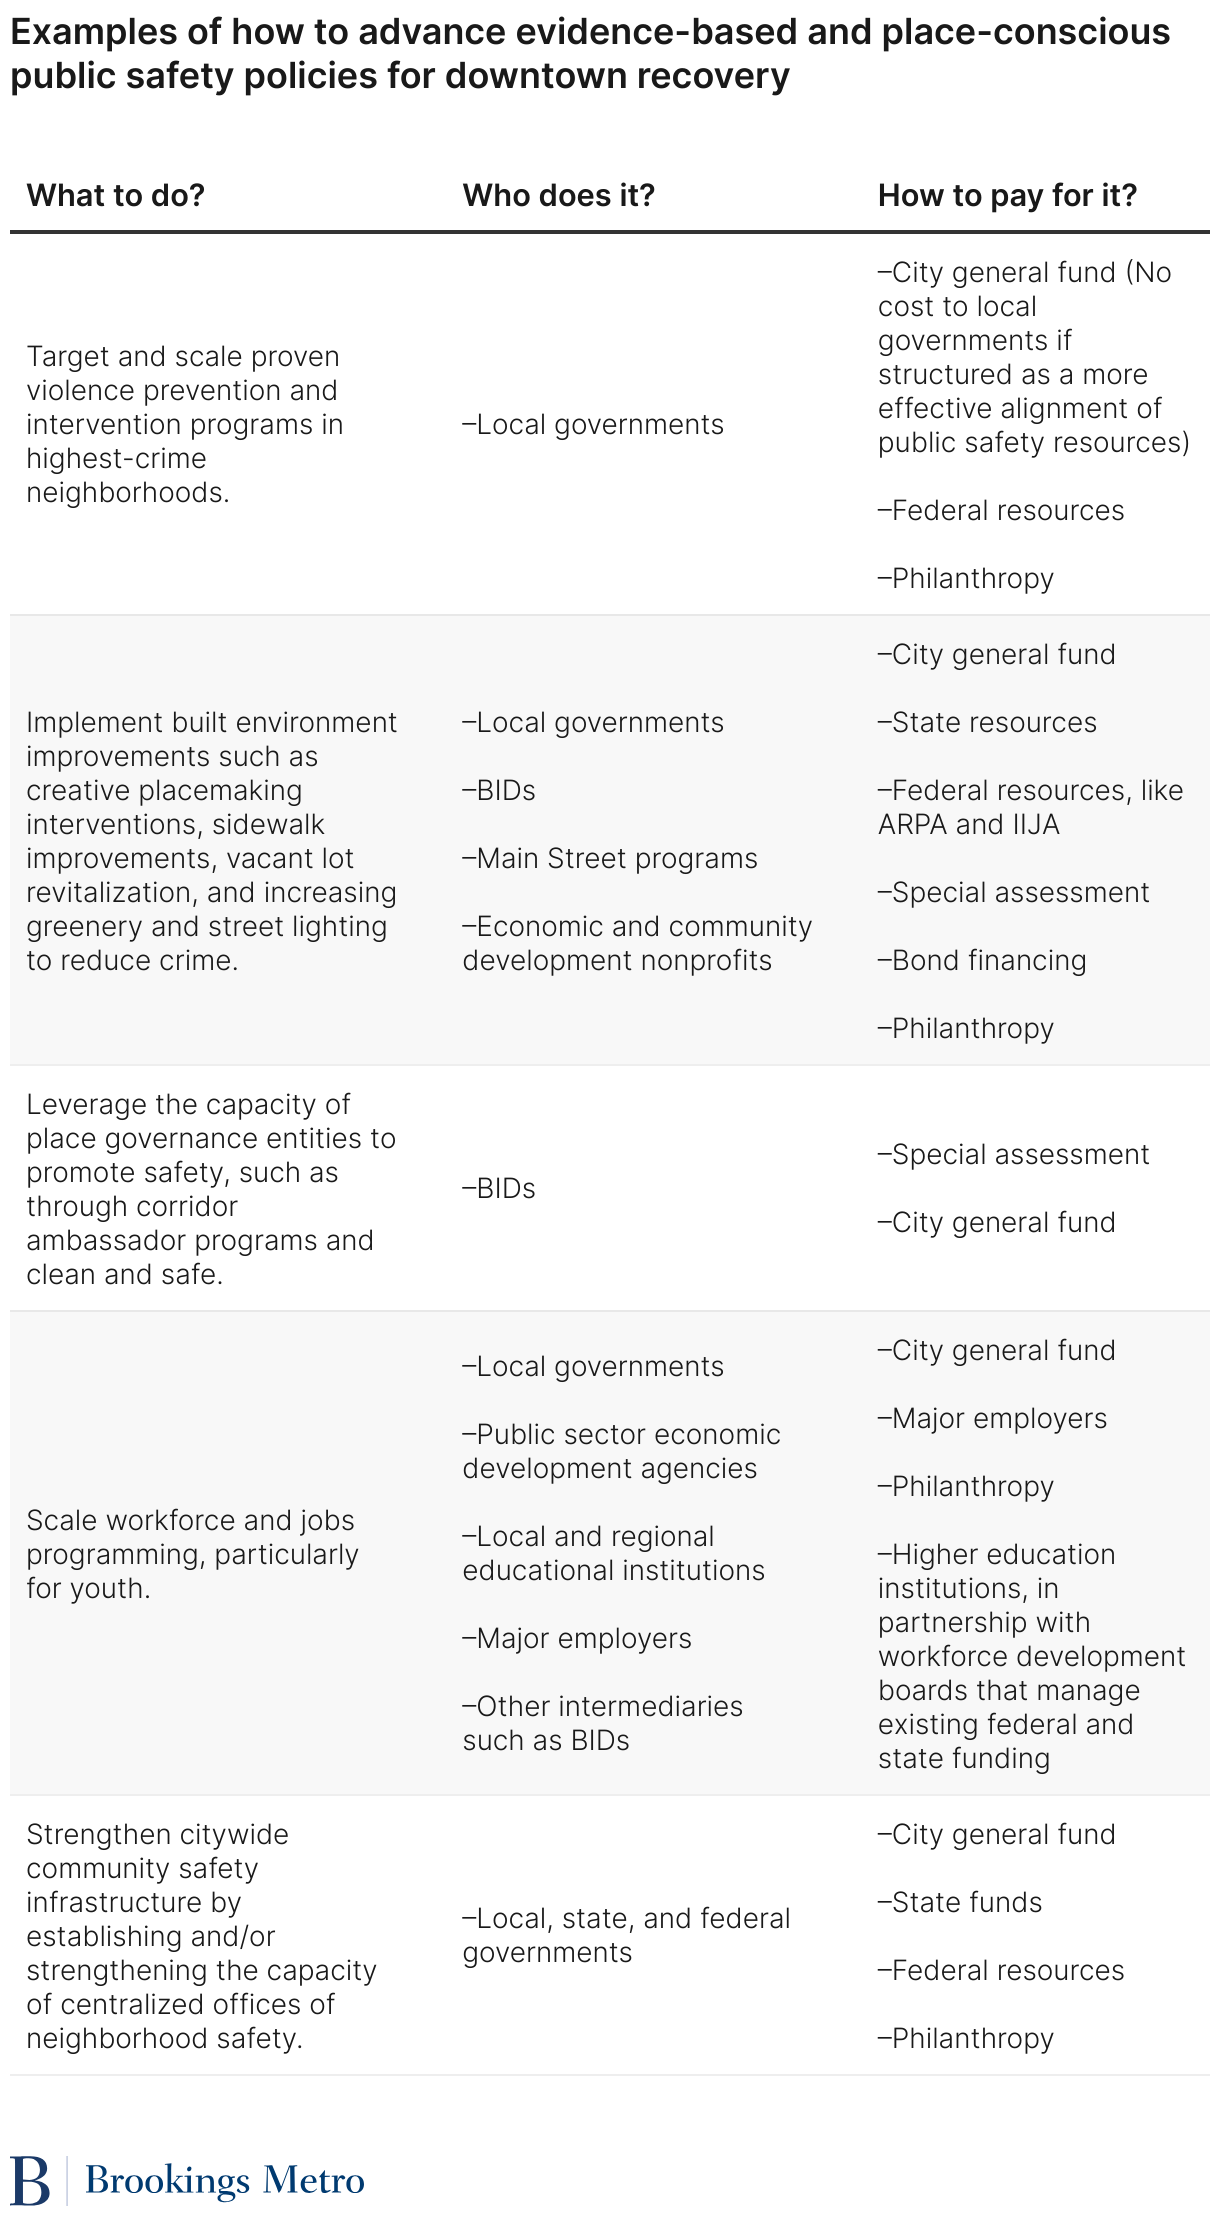
Below in Table 5 are several evidence-based recommendations to enable policymakers to better allocate crime prevention and reduction resources, while downtown leaders can effectively steward their resources to address both the perceptions and realities of crime in central business districts.
- Chicago’s community safety investments: The city of Chicago stands out as an example of how local governments can make large-scale investments in multiple evidence-based and place-conscious public safety measures. Notably, Chicago made large-scale investments in its citywide community safety infrastructure, budgeting nearly $19 million in ARPA funding to its Community Safety Coordination Center, which seeks to break down siloes and bring together community partners committed to health care, social services, education, restorative justice, faith, business, and other causes with government partners to effectively scale community violence intervention (CVI) projects. Chicago also allocated nearly $10 million in ARPA dollars to improve infrastructure and create safe community spaces in the areas of the city most impacted by violence. These investments, in addition to other holistic strategies like its Corridor Ambassador Program and Large Lots Program have helped the city take a more holistic, cost-effective, and humane approach to community safety.
5. Advance proven and humane approaches to addressing homelessness
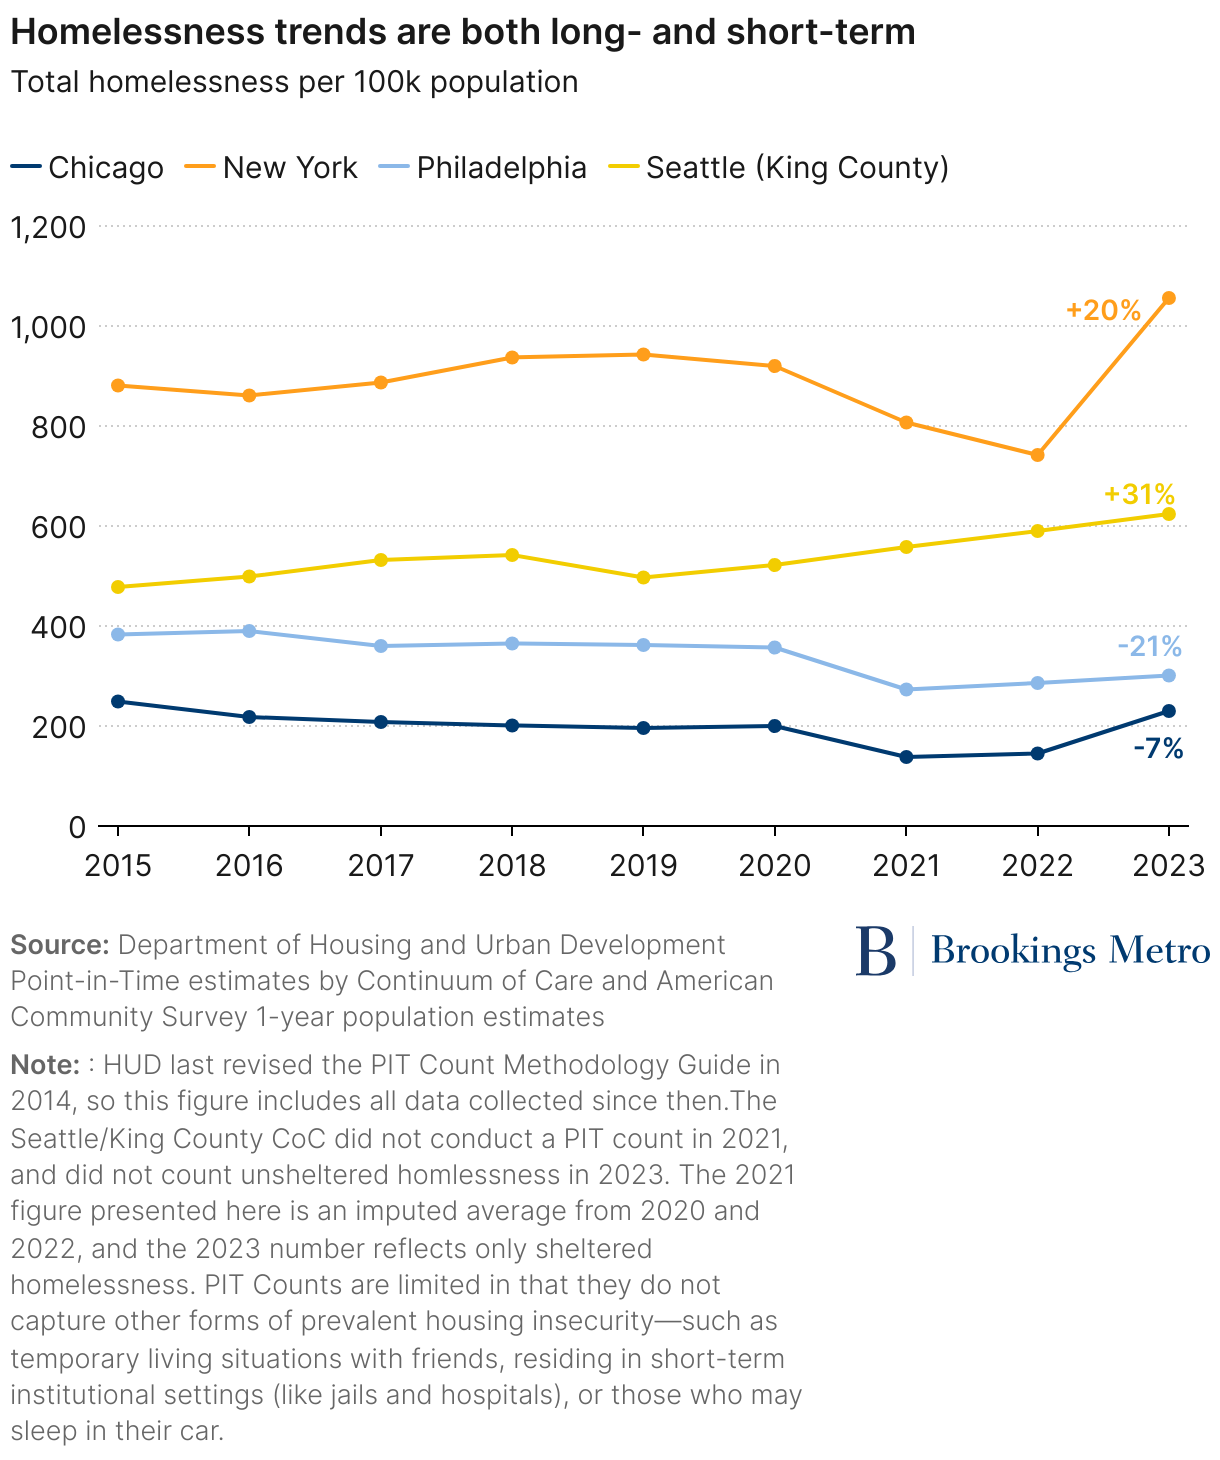
Of the four cities in the downtown cohort, progress on homelessness varied. We found that, while longer-term trends remained relatively consistent in three cities, between 2022 and 2023, New York in particular witnessed a 42% increase in total homelessness. While Chicago’s total homeless population also increased by 58% between 2022 and 2023, the city has seen progress over the long term, with the lowest baseline rate of homelessness across the cohort. Total homelessness rates have fallen by 7% since 2015, and unsheltered homelessness has fallen by 51% and continued falling even between 2022 and 2023.
With sharp increases in cities like New York and the long-standing challenge of rising homelessness in metropolitan areas on the West Coast, many local leaders are under political pressure to pursue punitive approaches like encampment sweeps and increased enforcement of quality-of-life offenses to quell concerns about homelessness. Unfortunately, many of these policies are costly and ineffective, pose significant risks to people experiencing homelessness, and risk making homelessness harder to solve.
By taking a closer look at pockets of progress, particularly in cities that have achieved sustained reductions in homelessness, local leaders can better heed the evidence and implement upstream solutions that can meet cities and regions where they are. We present some of these solutions below in Table 6:
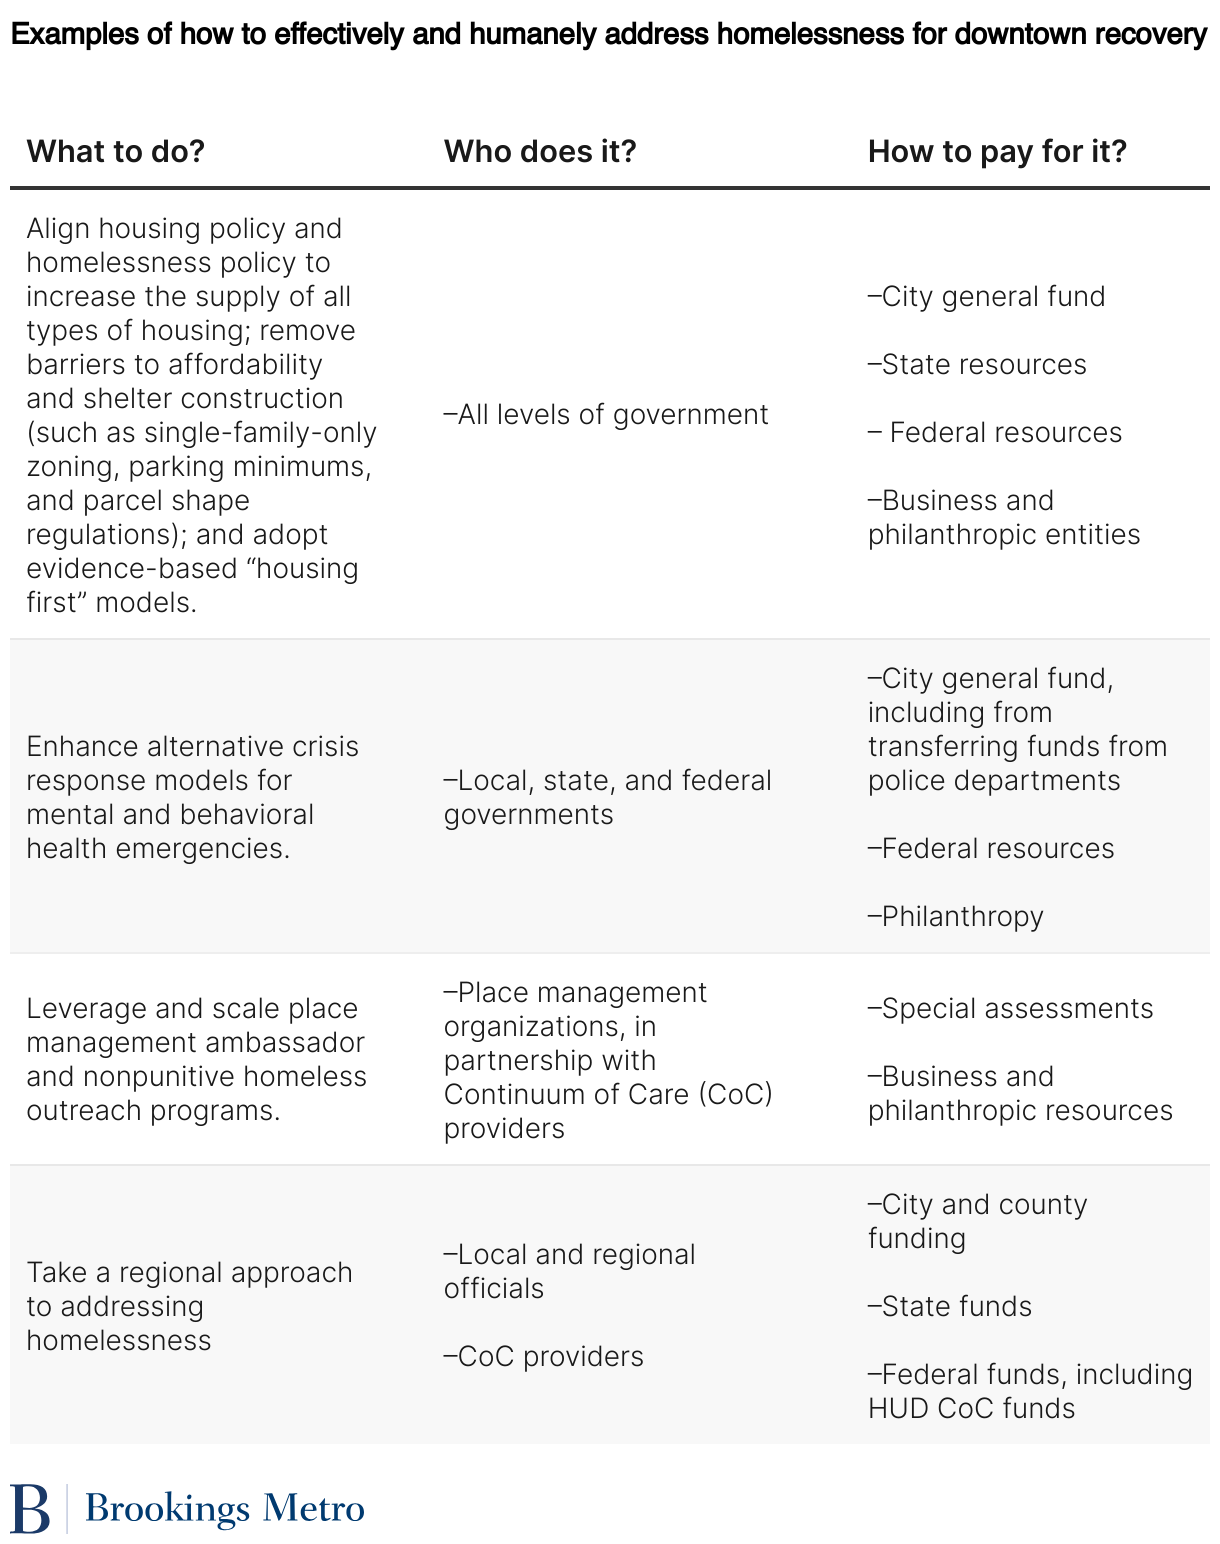
- Denver’s holistic approach to homelessness: The Metro Denver Homelessness Initiative is a regional CoC effort serving the seven-county Denver metropolitan area. Denver provides an instructive case study for scaling its successful alternative crisis response program, the Support Team Assisted Response (STAR) Program. Launched in 2020, STAR redirects nonviolent 911 emergency calls from police to a team of mental health specialists and paramedics. Inspired by the evidence-based CAHOOTS model in Eugene, Oregon, it focuses on providing appropriate care and resources to individuals facing mental health crises, substance use issues, or homelessness. Funded through the city’s general fund and a grant from the Caring for Denver Foundation, the STAR program aims to alleviate the burden on police resources, ensuring law enforcement can concentrate on more serious crimes. Its results so far show significant promise, producing a 34% reduction in lower-level crimes in areas served by STAR, with four times lower costs than those incurred with police-only responses.
6. Strengthen transit systems to physically connect downtowns, neighborhoods, and regions
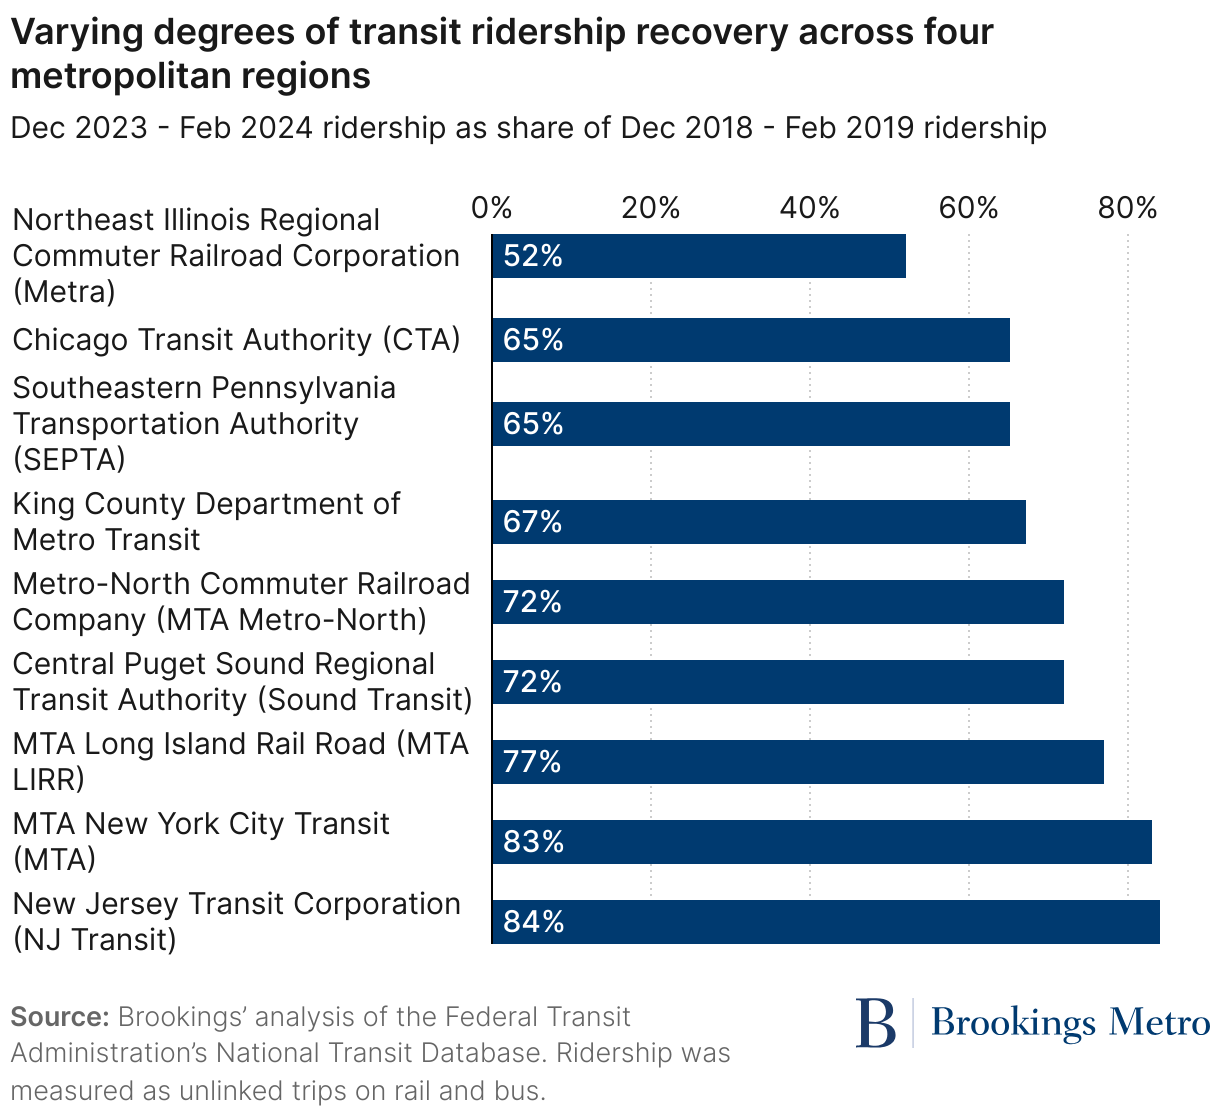
Most U.S. transit systems experienced serious disruptions to operations during the pandemic, including the deaths of essential workers, the challenge of adopting masking and distancing in closed settings more accustomed to crowding, and loss of fare revenue due to changing travel patterns. Health concerns evolved in many cases to broader public safety concerns about transit that became widespread during the pandemic and that were in part based on a real surge in transit crime in some places, including assaults on transit workers. Ridership recovery has been slow and varies widely across major transit systems (see Figure 12).
Prior to the pandemic, the six U.S. transit systems with the highest regional mode share also carried very high shares of commuting trips (49–61%), even though both before and after the pandemic less than one-fifth of all American trip-making is related to work.6 This mismatch between actual travel demand and what transit systems do is an existential threat. Yet there are key constituencies that cannot afford for transit to fail: the downtowns that thrive on proximity that high-volume roads and parking dilute; populations who do not drive, such as children, seniors, and people with disabilities; and those without access to cars, including the predominantly lower-income essential workers of color who have continued to use transit throughout the pandemic and during the subsequent recovery period.
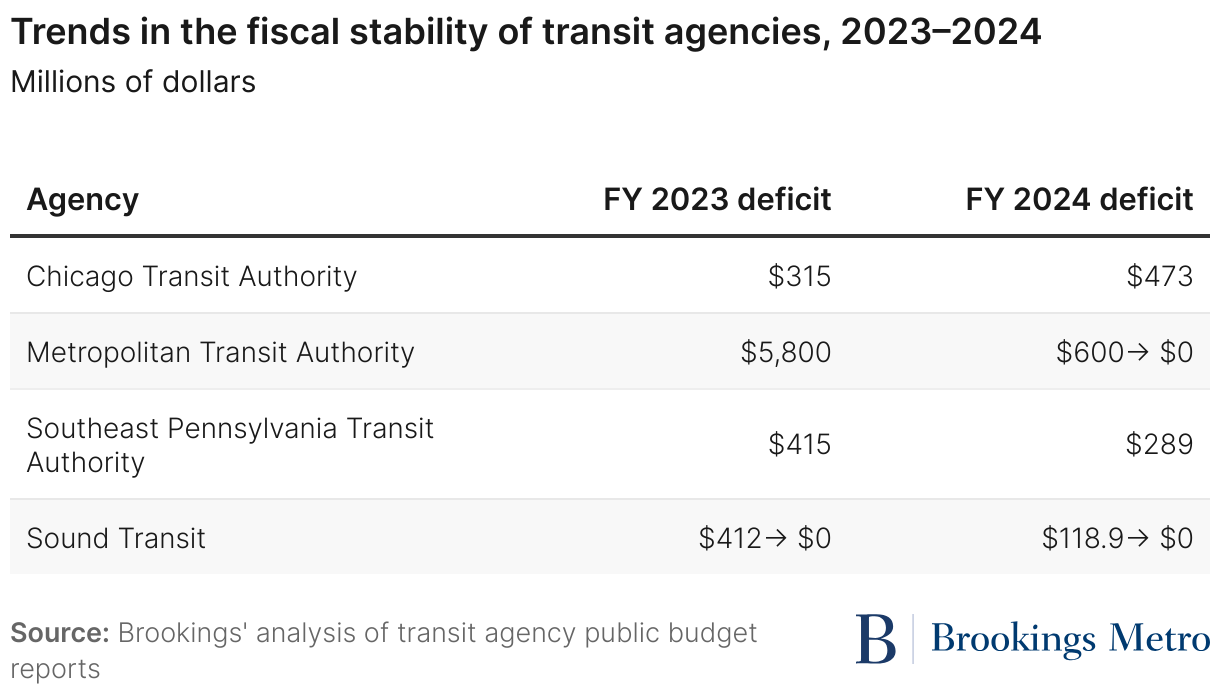
The only way to end the seemingly never-ending headlines of another transit fiscal cliff that haunt most U.S. metropolitan areas is to establish diverse, dedicated, long-term funding mechanisms from both traditional sources and innovative new ones tied to the economic value that transit systems help create such as congestion pricing, dynamic parking pricing, parking taxes, and so on. In the U.S. regions that have already done so, transit operations are stable and growing.
As shown in Table 7, Sound Transit had a balanced budget in fiscal year 2023 and fiscal year 2024 without the use of any cyclical or extraordinary federal relief. Instead, 63% of the system’s combined capital and operating budget is funded through dedicated regional taxes on car sales, property, rental cars, and general sales. Fares comprise only approximately 4% of this budget. Dedicated funding in excess of operations allows Sound Transit to plan operations and capital expenditures on a multiyear basis with low-interest debt, while maintaining an unrestricted cash reserve and earning investment income. Despite accessing this reserve in fiscal year 2023 and fiscal year 2024 in order to fund operations at the planned level (as shown in Table 7), the agency’s unrestricted cash balance actually grew by 112% between these two fiscal years.7
New York came within a heartbeat of securing similar multi-year financial sustainability for the Metropolitan Transportation Authority (MTA) before Governor Kathy Hochul’s recent announcement that implementation of congestion pricing would be indefinitely delayed. In addition to increasing dedicated operating funding sources such as payroll taxes and tolls, congestion pricing would have created a new dedicated capital funding source through an explicit embodiment of a new regional commitment to shared prosperity between downtowns and neighborhoods, with revenue from pricing of demand for downtown supporting transit accessibility for both city and suburban neighborhoods. However, congestion pricing is not the only way regions are raising new revenue for transit (see Table 8). Recently, Illinois created a new dedicated capital funding tool, the Transit Facility Improvement Area, a modified form of tax increment financing, which is now being deployed to finance construction of the Chicago Transit Authority’s Red Line extension.
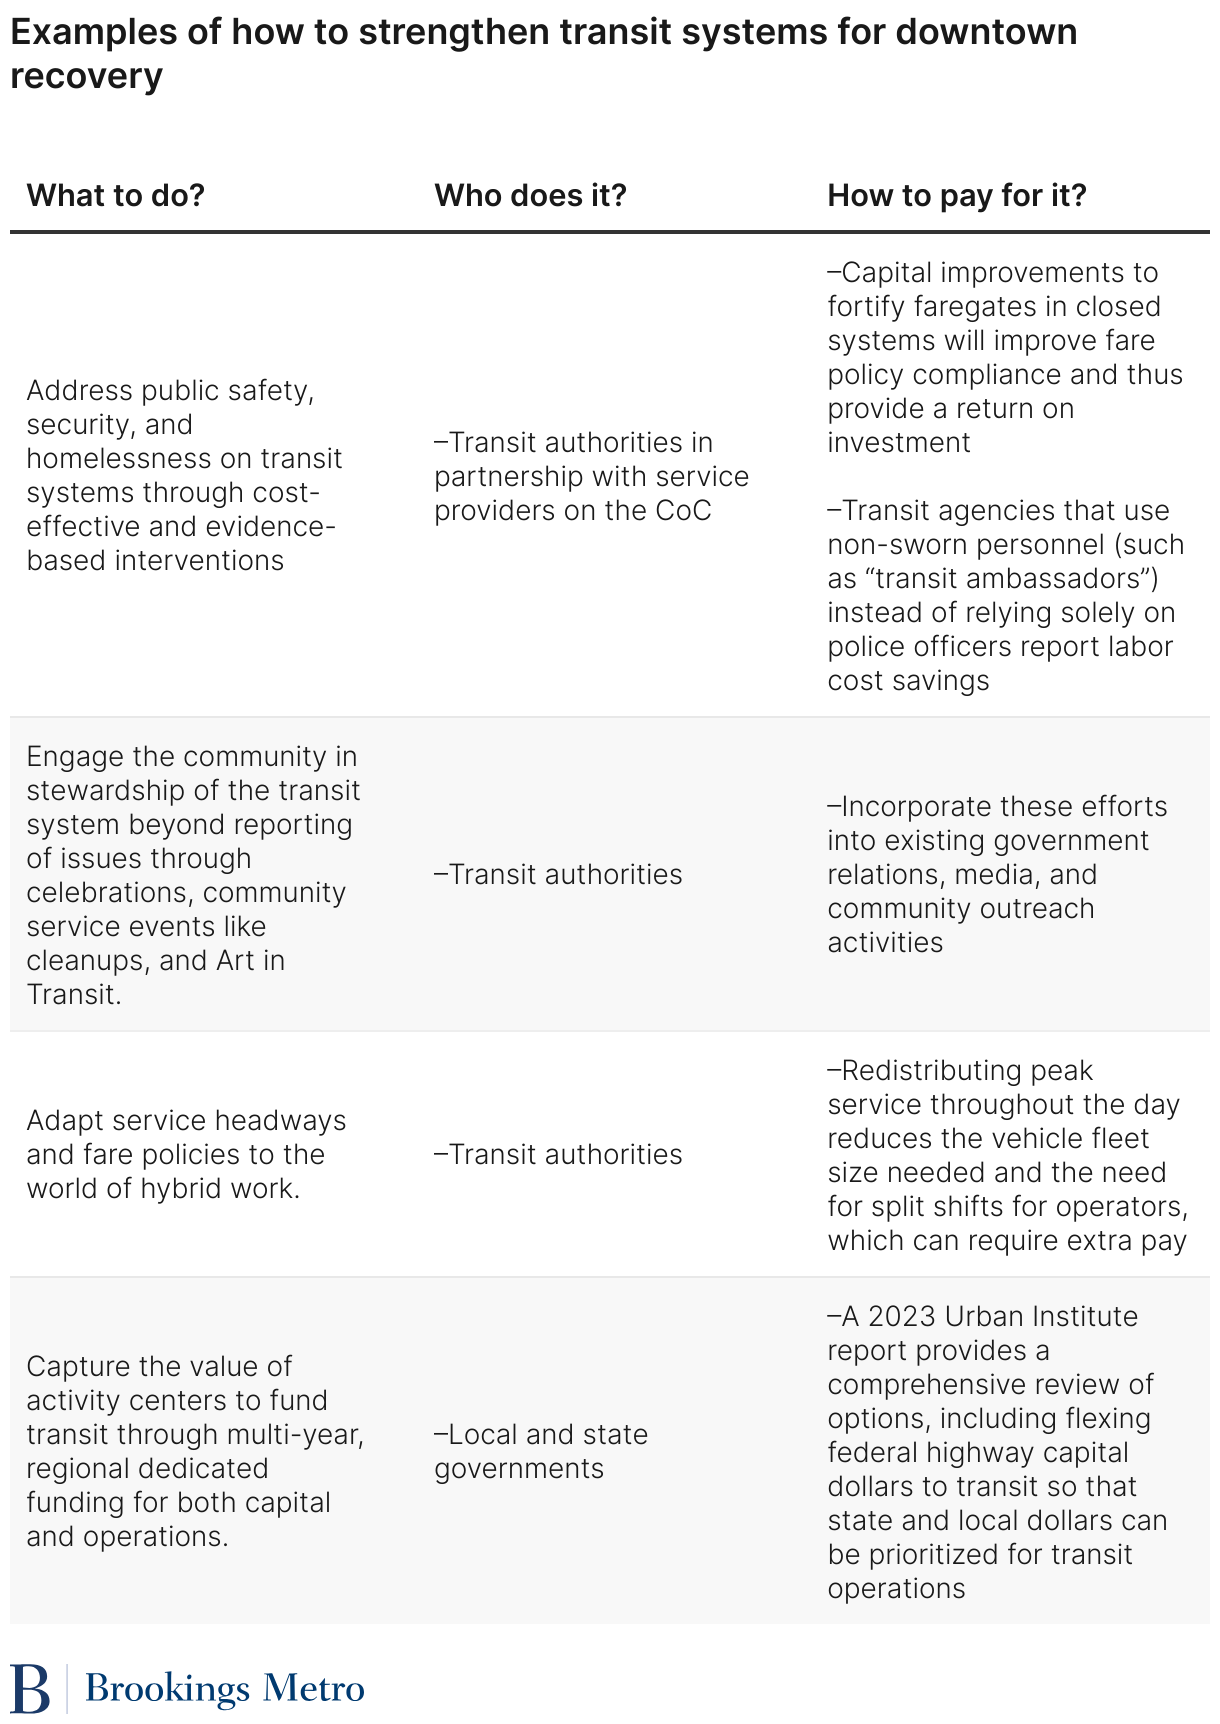
- SEPTA’s SCOPE Program: In Philadelphia, the Southeastern Pennsylvania Transportation Authority (SEPTA) has been recognized by national advocates and industry as an innovative leader for its holistic response to the intertwined health and safety crises of security, substance abuse, and homelessness. SEPTA’s “Safety, Cleaning, Ownership, Partnership and Engagement” (SCOPE) Program created an Outreach Services Department that includes crisis response and outreach teams trained in naloxone, de-escalation techniques, and other basic response tools, including the ability to coordinate across the CoC for homelessness services. The program also emphasizes building trust and confidence by improving customer experience on transit through cleaning, infrastructure improvements (like enhanced lighting), communications infrastructure, and an increased presence of nonsworn personnel who can provide simple customer service.
- Regional bus rapid transit in Austin: Cap Metro in the rapidly growing region of Austin has modernized transit operations to reorient beyond downtown commuting. The agency adjusted service headways to shift from weekday peaks to provide reasonably frequent, all-day/seven-day-per-week service on both downtown and circumferential routes that directly connect neighborhoods and suburbs. Transit agencies must also solve the paradox of making it effortless to choose transit by making fare payment as easy as tapping on a ride-hailing app, while keeping transit affordable for transit-dependent populations.
- Modernizing fares in New York City: In New York, the MTA’s OMNY open payments system, combined with fare capping, is designed to achieve this. Riders can pay with a single tap of a mobile phone wallet, credit or debit card, or MTA farecard, and every rider is essentially enrolled on a payment plan for a seven-day unlimited pass. Each ride is $2.90, and after 12 rides, the rest of the rides for the week are free.
7. Expand the cultural and entertainment options in downtown areas to reflect the hustle and culture of their whole city.
Office work is declining in dominance, and U.S. society is more diverse than ever. For downtowns to remain relevant, more kinds of people need to see something for themselves there besides offices. While many downtown organizations already have extensive track records of designing programming downtown, even very successful organizations have opportunities to deepen and strengthen their practice in ways that can connect them to broader local, regional, national, and international partnerships. Many downtown organizations can expand how they define success—not just in terms of aggregate economic impact, but in terms of individuals reached and engaged with.
For placemaking to be both inclusive and effective, it must achieve a balance between meeting the needs of incumbent individuals, groups, and histories, as well as attracting an expansive universe of visitors who have diverse and different attractions and attachments to a place.
In the average U.S. major city, a majority of workers come from outside the jurisdiction. Downtown place management organizations are typically governed by the property owners who are the landlords of these regional elites. This creates an understandable and natural disconnect between the direction and incentives that the downtown place management organizations are most accountable to and the city as a whole. Cities must therefore proactively create the organizational and governance capacity to connect downtowns and neighborhoods either within existing downtown organizations or through complementary efforts.
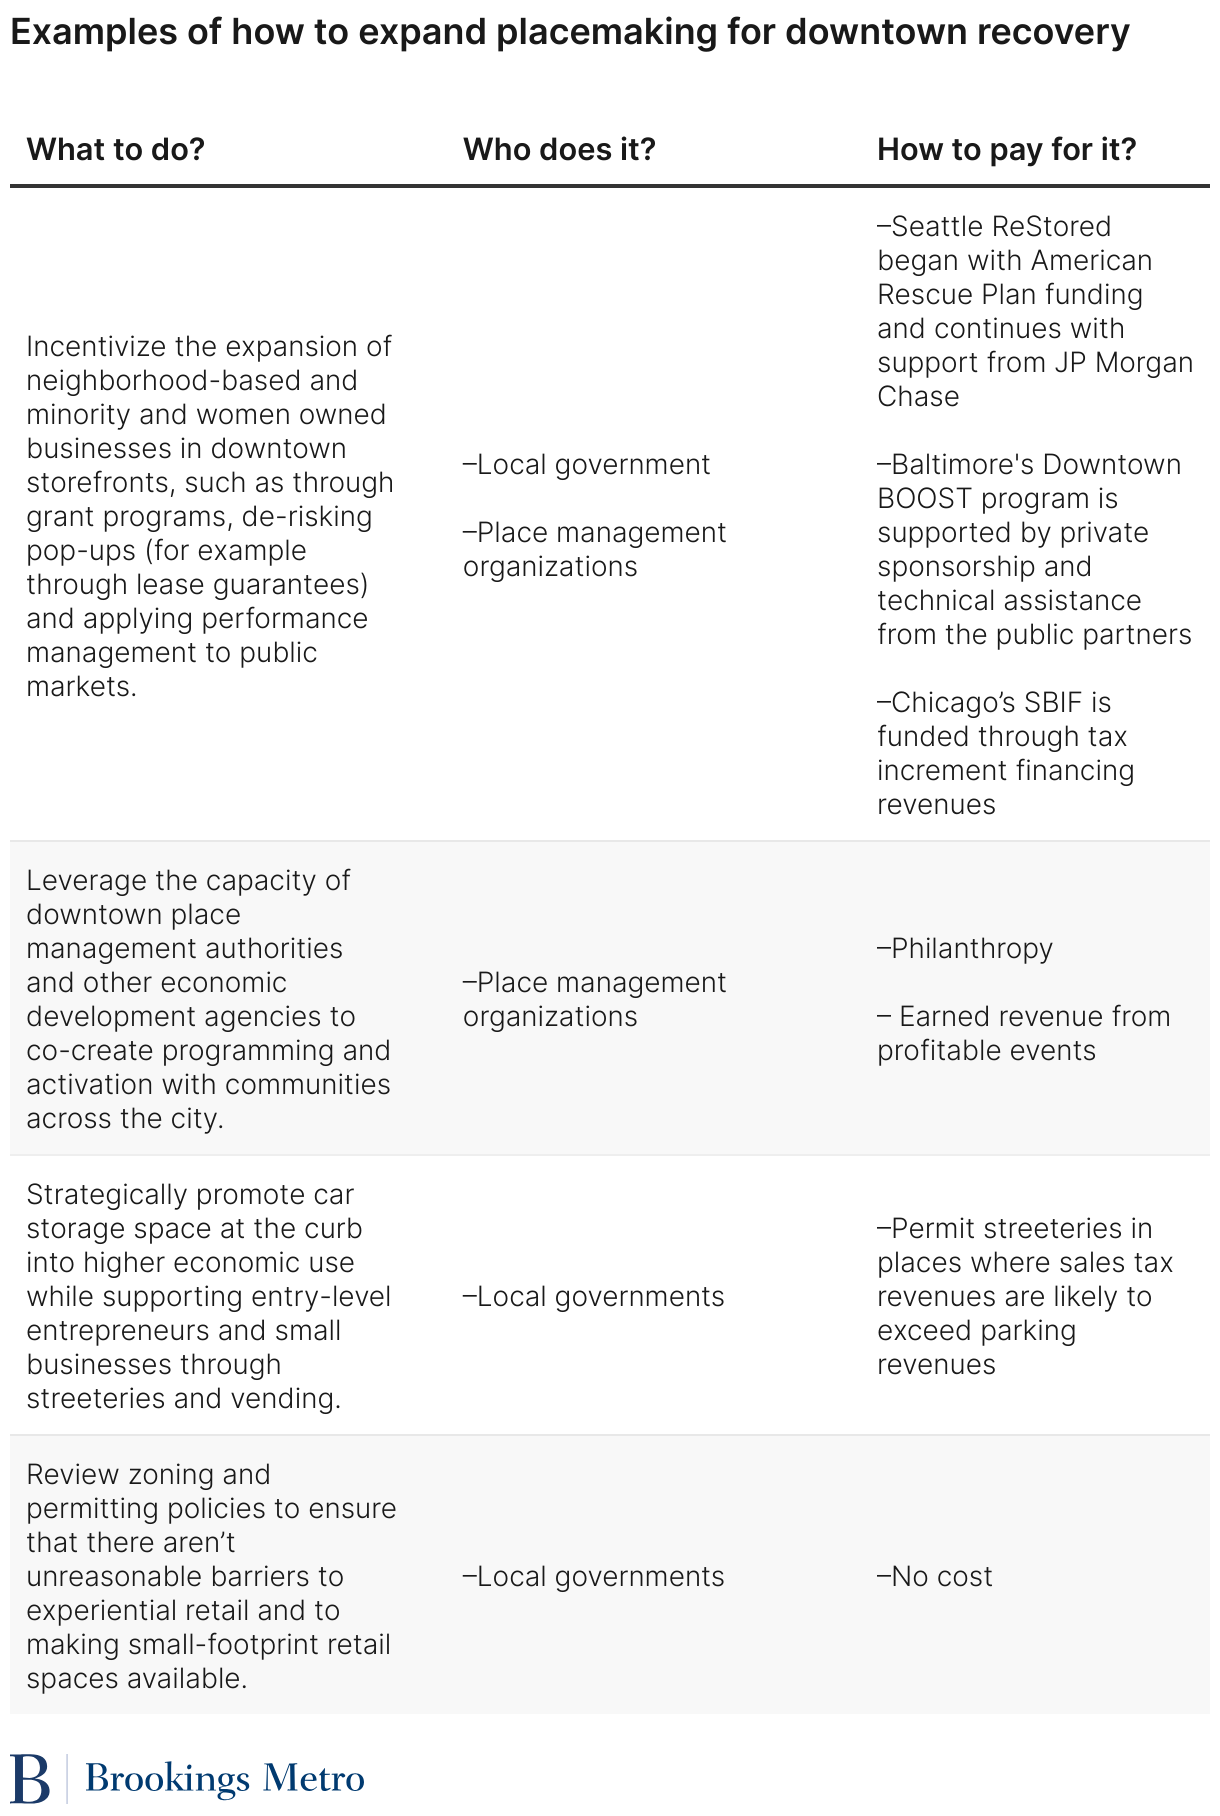
Several cities have started programs to bridge the gap (or gulf) between the commercial real estate owners and managers that control downtown retail locations and the local entrepreneurs who are immediately available to activate spaces and provide retail amenities (see Table 9). Examples include Seattle ReStored, Baltimore’s Downtown BOOST program, Boston’s Level Up Downtown, and the Cultural Showcase Pop-Ups program in Chicago. In all these examples, retail concepts that reflect the diversity of their home cities obtained downtown storefront spaces through alternative lease terms because either an intermediary de-risked the program through a master lease agreement or a catalytic landlord seeking broad public buy-in for a downtown revitalization program directly engaged with a grantmaking partner. In addition, Chicago’s Small Business Improvement Fund (SBIF) is a program that has long-supported neighborhood small businesses and has now expanded to downtown.8
- Seattle’s waterfront revitalization: In Seattle, the city’s Office of the Waterfront and Civic Projects’ transformation of the central waterfront has demonstrated how intentional design focused on people and community can enhance downtown public spaces and create opportunities for inclusive programming with a new Waterfront Park. This is living proof that inclusive placemaking efforts can succeed. The removal of the elevated highway known as the Alaskan Way Viaduct will ultimately create more than 20 acres of new public space connecting Seattle to its Salish Sea waterfront. In the fall of 2020, before coronavirus vaccines were available, the first phase of the Waterfront Park opened, an area known as Pier 62. City leaders did not simply hope that if they built it, diverse and local visitors would come. Neither are they forced to rely solely on earned revenue from private events whose hosts can afford to pay, thanks to significant municipal and philanthropic support, the latter provided by Friends of Waterfront Park, a nonprofit partner with the city of Seattle that is responsible for fundraising, stewarding, and programming at Waterfront Park. Instead, through partnerships between the city, Friends of Waterfront Park, and community organizations, this nonprofit is able to adopt a proactive strategy with the following components that deliver a non-tokenizing, expansively diverse constituency of park users and activators: 1) forming well-supported community partnership committees; 2) hiring a diverse team of community outreach specialists who embody the diversity of the city; 3) proactively advertising in hyperlocal newsletters and media to solicit community interest in co-creating park programming; and 4) raising and sharing the resources necessary to support the execution of ideas and requests for events of all sizes from communities all over Seattle. Beyond a focus on successful programming, Seattle has also been intentional about ensuring that the park will be well taken care of in the future. The city’s Seattle Center at Waterfront Park team manages operations, maintenance, and public safety in the new park, which provides a clean, well-maintained, and safe experience for its users. Thus, in just two years Pier 62 has successfully hosted everyone from the Salmon Homecoming and public radio station KEXP’s “Beats and Eats” to revenue-generating, ticketed events such as Taste Washington.
This is not to say that the secret to inclusive downtown revitalization is materializing billions of dollars to tear down a highway, build a new waterfront, and then further leverage extraordinary philanthropic investment to offer the public space fruits to all. Without any new dollars, every downtown already has enormous amounts of public space that can be managed with similar proactive intent to create shared prosperity: streets. During the pandemic, many cities experimented with new ways to allocate road right-of-way in order to provide safe spaces to gather and strengthen local businesses. For example, the city of Chicago and the Chicago Loop Alliance closed all of State Street to vehicular traffic and programmed a vast downtown block party, Sundays on State, welcoming over 1 million visitors to support diverse activation participants (91% of whom were underrepresented business owners). Promoting cleaner air and calming traffic remain important public health priorities that return real social and economic value to cities as well. The challenge for cities now is to institutionalize such efforts and both formalize and normalize them as a permanent part of the cityscape and city life without burying them in red tape and high capital and operating costs.
Conclusion
American downtowns have weathered their share of economic disruptions before and emerged resilient. Downtowns will recover from these disruptions as well—their unique locational advantages and economic power are central to the innovation, climate resilience, and connectivity needed for America to prosper.
The key for the future of downtowns is not just acting as regional and national engines of economic prosperity, however, but broadening the coalition of who benefits from this prosperity. The deepening of spatial and racial inequality in the United States is unsustainable, and downtowns have the assets, connections, and power to reaffirm cities’ historical role as inclusive hubs for diverse residents across income levels, age, race, and gender.
To broaden who benefits from downtowns, the current coalition of downtown stakeholders can’t achieve this alone. In addition to the strengths and expertise of BIDs, real estate developers, and major employers, a broad swath of residents, placemakers, service providers, and multidisciplinary experts have the often-undervalued knowledge and experience needed to advance shared recovery. What too often has been missing is a shared language to align a shared set of goals. Our hope is that this report provides the framework and tools for such a broad coalition to succeed.
-
Acknowledgements and disclosures
The authors extend deepest appreciation to the participants in the 2022–2023 Brookings Future of Downtowns Learning Exchange. The participants include:
New York City: Julie Stein, Kelly Gu, Jessica Lappin, Fred Cerullo, and Aaron Charlop-Powers
Chicago: Samir Mayekar, Michael Edwards, and Antonio Benecchi
Philadelphia: Paul Levy, Prema Gupta, and Anne Fadullon
Seattle: Markham McIntyre, Rico Quirindongo, Kylie Rolf, Rachel Smith, and Alicia Teel
The authors also thank Tim Tompkins and Alan Berube for their thoughtful review of earlier drafts of this piece, while noting that any errors that remain are solely those of the authors.
In addition, this work would not have been possible without the invaluable research assistance of DW Rowlands and Mary Elizabeth Campbell.
-
Footnotes
- San Jose, Las Vegas, and Honolulu have unique industrial compositions that result in very high productivity per worker in San Jose and very low productivity per worker in Las Vegas and Honolulu. This composition effect could be captured in a multivariate model, but for the purposes of presenting a simple bivariate model that accurately illustrates the relationship in question for most U.S. metro areas, we excluded these regions.
- See table appendix in previously published work. These downtowns are defined as the commercial cores of every census metropolitan statistical area in the United States with a regional population of at least 1 million people. Further detail on the methods used to define downtowns, as well as illustrative maps and geospatial data files, is available in previously published work.
- Brookings’ analysis of the 2019 LEHD Survey.
- It is important to note that there are also second–order and nearer-term impacts on own-source revenue beyond commercial property tax receipts. Lost sales taxes from commuters—and in the case of Philadelphia, lost wage taxes—can also cause large negative fiscal impacts.
- See table appendix in previously published work. These downtowns are defined as the commercial cores of every census metropolitan statistical area in the United States with a regional population of at least 1 million people. Further detail on the methods used to define downtowns, as well as illustrative maps and geospatial data files, is available in previously published work.
- See Table 4-4 on page 28 of the linked report.
- This estimate was created by comparing cash reserve balances reported on page 16 of the fiscal year 2023 budget book and page 19 of the fiscal year 2024 budget book.
- The International Downtown Association has curated extensive case studies and analyses of “retail equity” programs that are available for its members. Public markets are an even more direct way to accomplish the same goal. The same is true of street vending (including food trucks)—while once an economic option of last resort, today most vendors are entrepreneurs exiting other employment and moving into their first ownership opportunity.